
Все способы:
- Для чего нужна BlueScreenView
- Интерфейс BlueScreenView
- Работа с BlueScreenView
- Включение сохранения дампов памяти
- Вопросы и ответы: 0
Для чего нужна BlueScreenView
BlueScreenView представляет собой специальную программу, предназначенную для анализа аварийных дампов памяти – файлов DMP, автоматически создаваемых Windows в момент критического сбоя и содержащих различные диагностические данные. Программа ориентирована на технических специалистов, но она может быть полезной и рядовым пользователям. В частности, с ее помощью пользователи легко могут определить код критической ошибки, если он не отображается на экране BSOD или экран быстро пропадает, из-за чего запомнить или записать его не удается. О том, как его определить, читайте по ссылке ниже – на нашем сайте этой теме посвящена отдельная статья.
Подробнее: Как определить код синего экрана в Windows 10
Скачать BlueScreenView с официального сайта
Интерфейс BlueScreenView
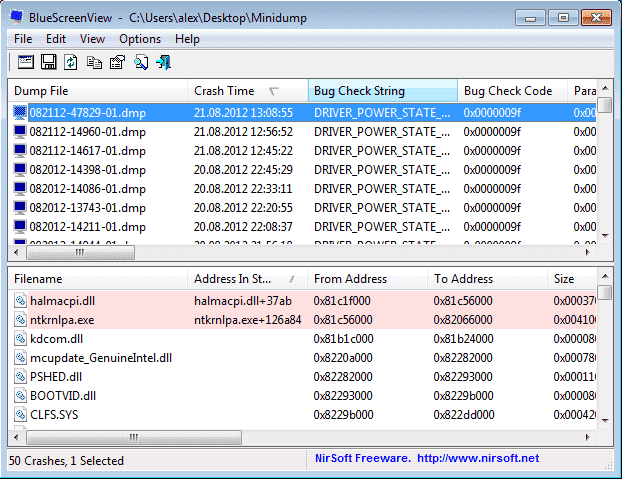
Программа BlueScreenView достаточно проста в использовании, однако перед тем как приступать к анализу в ней дампов памяти, необходимо ознакомиться с ее интерфейсом. Рабочее окно приложения представлено двумя горизонтальными панелями, из которых на верхней выводится список анализируемых дампов памяти с их параметрами, а на нижней отображается список связанных с конкретной ошибкой системных файлов с их параметрами. Большинство из них представляют интерес только для технических специалистов.
| «Файл дампа» | Имя файла дампа |
| «Время аварии» | Момент времени, в который был зарегистрирован сбой |
| «Текст ошибки» | Название ошибки, обычно отображается на экране BSOD |
| «Код ошибки» | Шестнадцатеричный код, указанный или не указанный на синем экране |
| «Драйвер причины» | Файл драйвера, вызвавшего критический сбой |
| «Адрес причины» | Файл драйвера плюс относительный адрес инструкций |
| «Параметры» | Адреса инструкций, информация для технических специалистов |
| «Стек-адреса» | Файл драйвера плюс используемый адрес в памяти |
Также на верхней панели выводятся такие сведения, как описание сбойного файла, название производителя, номер версии, разрядность процессора, адрес аварии, размер файла и полный к нему путь. На нижней панели выводятся данные, относящиеся к связанным с ошибкой файлам: имя файла, адрес в стеке и памяти, временные метки, размер, описание, название продукта, версия, полный путь и так далее.
Работа с BlueScreenView
В отличие от интерпретации результатов анализа файлов дампов, работа с приложением не представляет особой сложности. BlueScreenView не нуждается в установке, на странице разработчика доступен для скачивания файл русификации.
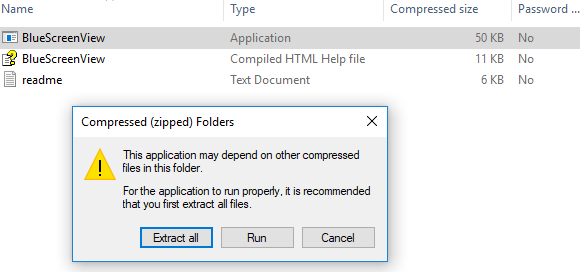
- Скачайте архив с программой и архив с файлом русификации и распакуйте их в любое удобное расположение.
- Поместите языковой INI-файл в папку с исполняемым файлом BlueScreenView, после чего запустите программу от имени администратора.
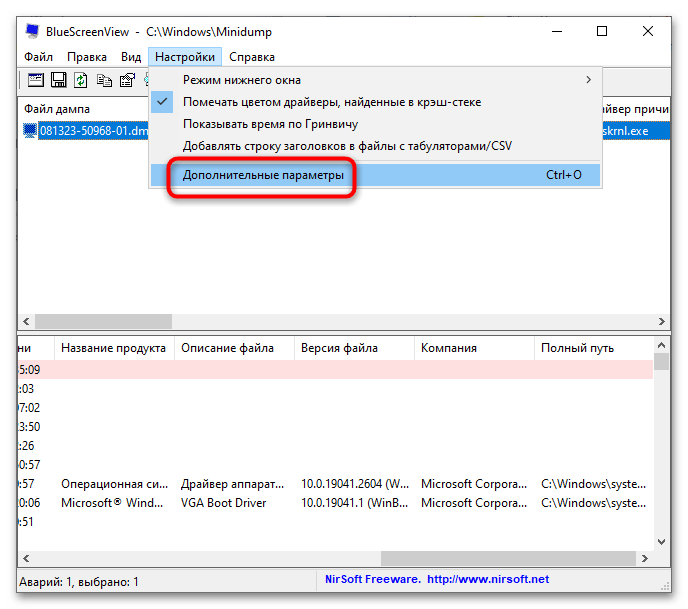
- По умолчанию BlueScreenView сканирует содержимое папки минидампов, расположенных в директории по умолчанию —
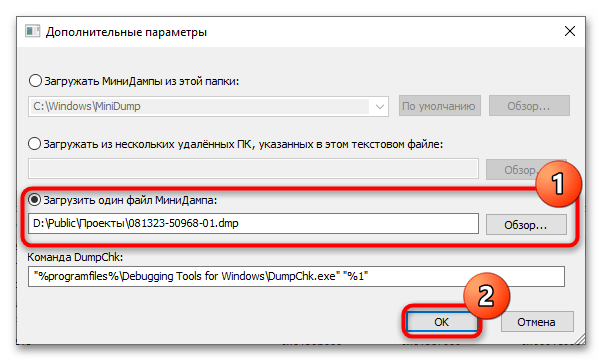
C:\Windows\Minidump. Если файл дампа находится в другом месте, перейдите в меню «Настройки» и выберите пункт «Дополнительные параметры». - В открывшемся окошке включите радиокнопку «Загрузить один файл МиниДампа» и укажите к нему путь. Нажмите «OK».
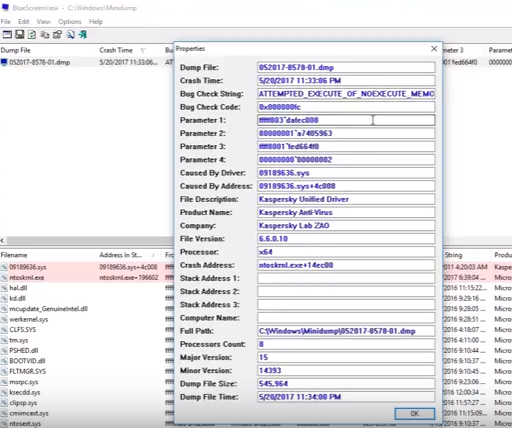
- Выделите на верхней панели загруженный файл дампа мышкой, чтобы получить по нему сведения.
- Из последних интерес главным образом представляют:
- На верхней панели: «Текст ошибки», «Код ошибки» и «Драйвер причины».
- На нижней панели: файлы, выделенные розовым цветом. Как правило, это драйверы или исполняемые EXE-файлы.

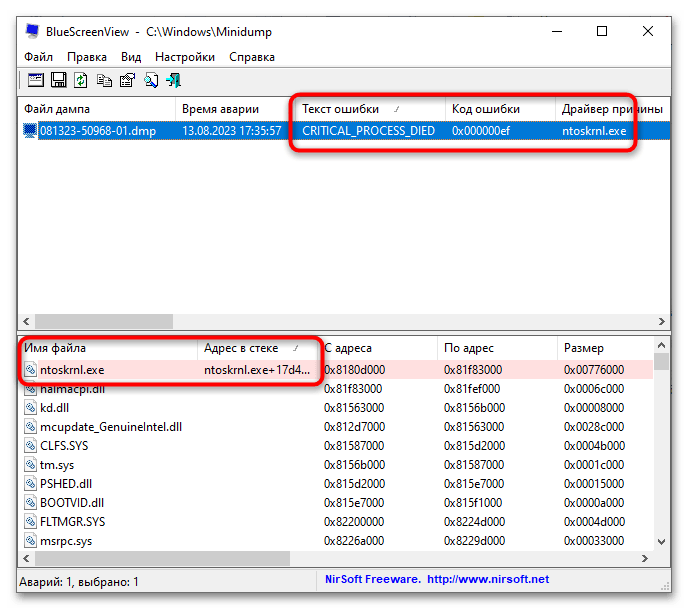
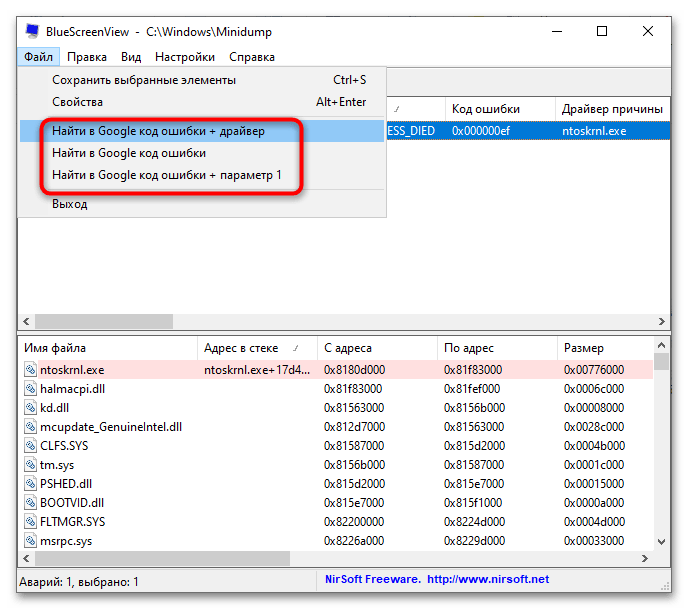
Располагая этими базовыми сведениями, выполните поиск решения в интернете или на нашем сайте. Например, можно сформировать такой запрос: «Ошибка CRITICAL PROCESS DIED, код 0x000000ef, файл ntoskrnl.exe». Как вариант, соответствующую опцию поиска можно выбрать в меню «Файл».
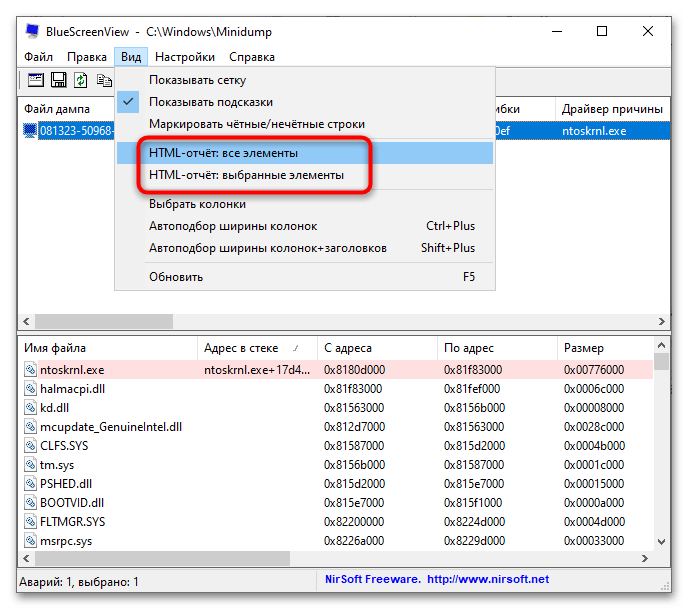
Если найти причины ошибки не удалось, можно сохранить полученные данные в файл HTML-отчета из меню «Вид» и отправить его в поддержку Microsoft.
Также за помощью в решении проблемы можно обратиться к техническим специалистам, системным администраторам и опытным пользователям на специализированных сайтах и форумах.
Включение сохранения дампов памяти
Программа не сможет отображать отчеты для анализа, если в операционной системе отключено сохранение отчетности о сбоях системы. Включите эту функцию в настройках, чтоб в результате следующего БСОД был создан необходимый минидамп.
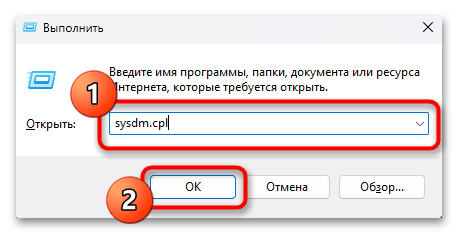
- Нажмите клавиши Win + R для запуска диалогового окна «Выполнить» и вставьте в него команду
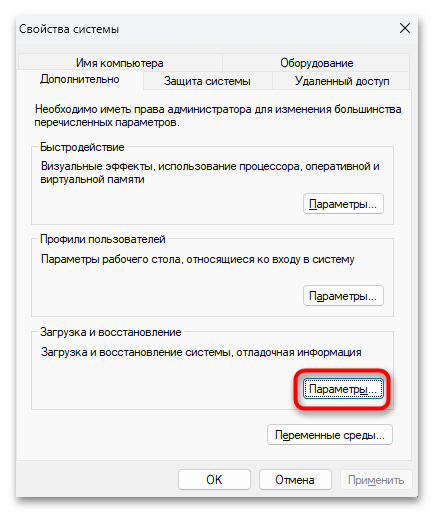
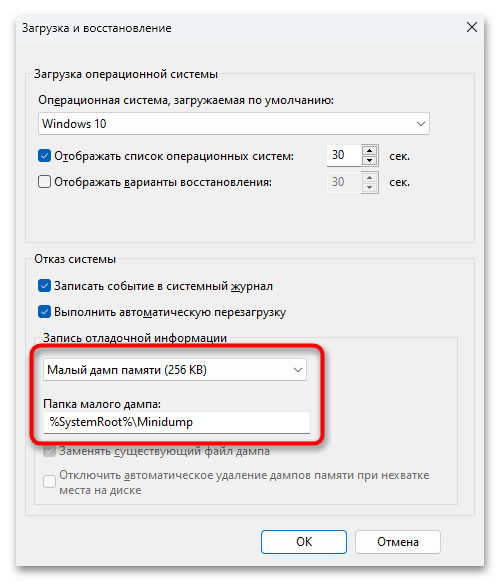
sysdm.cpl, а затем нажмите клавишу Enter или кнопку «ОК». - В блоке «Загрузка и восстановление» кликните по кнопке «Параметры».
- В новом окне вызовите выпадающее меню у «Запись отладочной информации», выставьте «Малый дамп памяти (256 КБ)». При желании тут же можете изменить место сохранения лога. Закройте все окна кнопками «ОК».
-
О программе
-
Создание файла дампа
-
Анализ дампа памяти
У пользователей ПК есть сильный страх, который всех объединяет – BSOD (Blue Screen of Death, «синий экран смерти») – критическая ошибка, которая приводит к аварийному завершению работы системы без сохранения данных. Рядовому пользователю сложно расшифровать информацию о сбое, если после отображения технической информации компьютер сразу перезагружается. Поэтому рассмотрим, как пользоваться BlueScreenView – приложением, которое сохраняет и расшифровывает сведения о сбое в работе ОС.
О программе
BlueScreenView – это программа, которая создает дамп памяти во время возникновения BSOD-ошибки и анализирует его, предоставляя информацию о причинах сбоя. Другими словами, приложение фиксирует и объясняет нам способы исправления системных ошибок.
Утилита предоставляет информацию о сбойном драйвере или компоненте, указывая версию и краткое описание. Особенность – приложение имеет встроенную командную строку.
BlueScreenView скачать можно по ссылке – загрузить
Создание файла дампа
В операционных системах Windows 7, 8, 10 дамп оперативной памяти сохраняется автоматически. Но мы отредактируем настройки создания файла и оптимизируем их под BlueScreenView.
Пройдем по следующим пунктам:
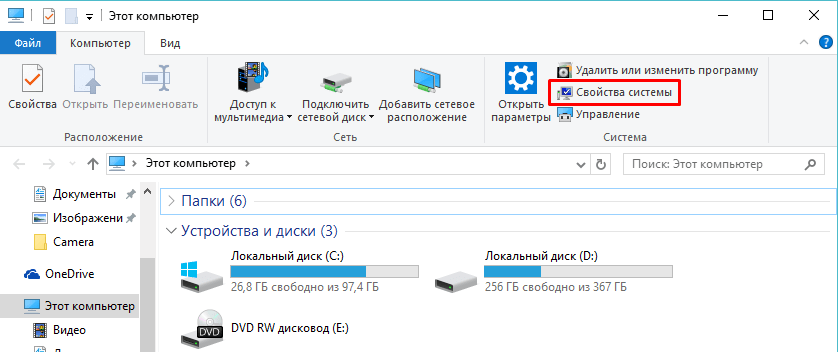
- Откройте «Этот компьютер» – «Свойства системы».

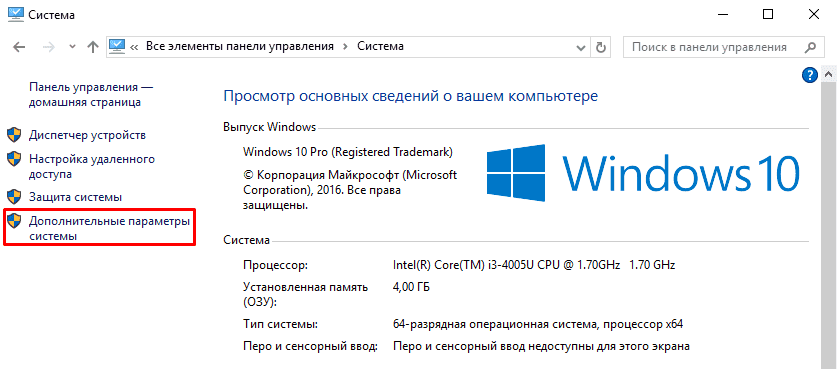
- Нажмите «Дополнительные параметры системы».

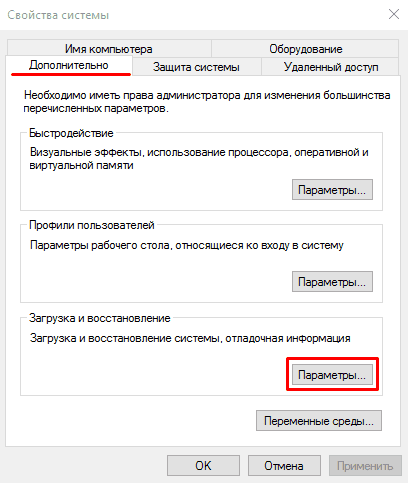
- Во вкладке «Дополнительно» кликните на кнопку «Параметры» в блоке «Загрузка и восстановление».

- В появившемся окне уберите галочку с пункта «Заменять существующий файл дампа» и в поле «Запись отладочной информации» выберите «Малый дамп памяти (256 KB)».

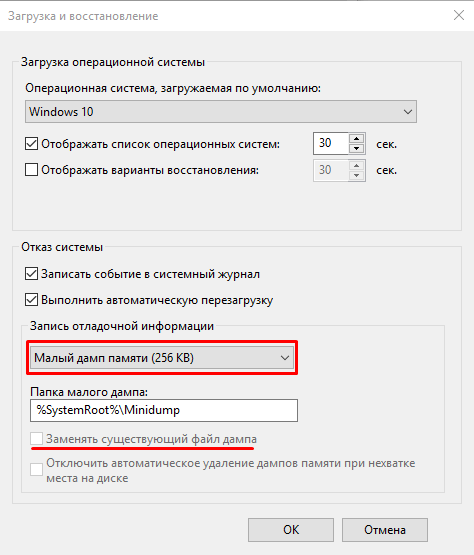
Справка! Малый дамп памяти содержит необходимую информацию для анализа ошибки и не занимает много дискового пространства. А заменять существующий файл дампа не рекомендуется, т.к. ошибок несколько, а записывается – одна.
Анализ дампа памяти
Первым делом запустите BlueScreenView. Приложение автоматически сканирует папку хранения всех дампов памяти.
Для извлечения необходимой информации нужно:
- Выбрать нужный .dmp файл из списка, посмотреть на перечень драйверов и компонентов, загружавшихся во время последнего запуска ОС.

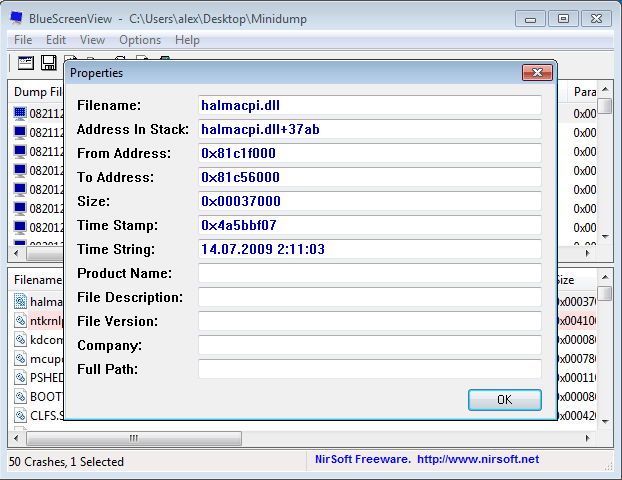
- Дважды кликнуть на поле, подсвеченное красным цветом.
- Ознакомиться с технической информацией об ошибке.

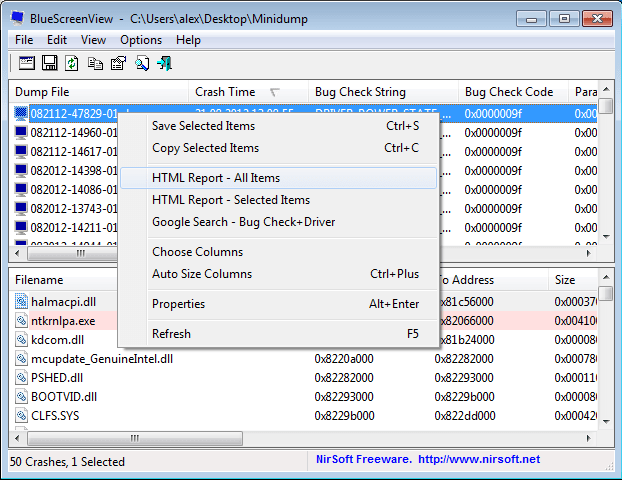
- Кликнув ПКМ на поле дампа памяти, вы можете импортировать данные в файл для последующей отправки специалисту или в службу поддержки. Также предусмотрена возможность поиска решения проблемы напрямую с приложения.
В итоге можно сказать, что пользоваться BlueScreenView – сплошное удовольствие. Это маленькая и функциональная утилита, которая освободит вас от необходимости караулить BSOD-ошибки с листом бумаги в руках.
Для желающих предоставляется видео о том, как пользоваться BlueScreenView.
Download Windows Speedup Tool to fix errors and make PC run faster
Blue Screen of Death (BSOD) also known as Stop Error is displayed on the Windows system after a system crash when your operating system reaches a threshold where it can no longer function safely. The stop error gets its name as the blue screen error because the alert message is displayed on a blue screen with the sad emoticon and a QR code which suggests a few possible fixes.
A BSOD usually occurs because of several reasons like corrupted Windows registries, bad drivers, misconfigured device drivers, corrupted files, outdated drivers, memory issues, and system hardware issues. Once you come across BSOD, your system will require you to reboot to continue to operate. However, before the reboot, it is recommended that the users make a note of the error message and error code.
The BSOD error is mostly displayed when your system is unable to recover the kernel-level error. The error message usually displays the driver data associated with the error and other information about the issue, and its possible fixes. Also when your system crashes with a BSOD error, the system creates minidump files, and all the memory data with the error details are dumped to a hard drive for future debugging. There are many ways in which you can read the minidump files for troubleshooting, including using the Windows Event Viewer. But the easiest way is using a free and handy utility called BlueScreenView that allows users to easily read the error report for troubleshooting.
BlueScreenView is a user-oriented utility that automatically scans all the minidump files which were created after the BSOD crash into a single table. For every crash occurrence, BlueScreenView gives details about the driver that was loaded during the crash, and other crash information in order to easily troubleshoot the problems and locate the suspected problematic drivers. Additionally, the free tool displays the blue screen error screen quite similar to the one that Windows displayed during the time of the system crash.
Using Blue Screen View is quite easy. All one has to do is run the executable files which will automatically scan all the minidump files that were created during the crash. It mostly displays the dump files created by a crash at the top pane and displays the associated drivers in the lower pane. In this article, we explain how to use BlueScreenView to read the crash report.
Once you have downloaded and installed it, run the BlueScreenView.exe executable file.
After running the executable file, the BlueScreenView automatically scans all your minidump folder to display the crash details. It displays the dump files created by a crash at the top window pane and displays the associated drivers in the lower window pane.

To know the properties of the error, double-click on the drivers which display the error details in a table format.
Users can also send an HTML report to the technician for troubleshooting. To do this, right-click on a dump file and select the HTML Report- All Items or HTML Report -selected Items from the drop-down menu.
You can also save the reports for debugging the recurring issues. To do this, right-click on a dump file and select the option Save Selected Items.
BlueScreenView allows its user to customize the columns which you would like to make visible and reorder the columns with Move up / Move Down button.
It is also available in other languages. To change the language of BlueScreenView, download the appropriate language zip file, extract the ‘bluescreenview_lng.ini’, and put it in the same folder where you installed the utility.
BlueScreenView is designed to run on the versions of Windows and can read the minidump files created by both 32-bit and x64 systems. The utility is available in different languages, and you can download it here.
I hope you find this post useful.
Also read: How to use Windbg to troubleshoot Blue Screen stop errors.
Pavithra is a Windows enthusiast, who loves keeping abreast with the latest in the world of technology.
Reader Interactions
| BlueScreenView v1.55 Copyright (c) 2009 — 2015 Nir Sofer |
Related Utilities
- WinCrashReport — Displays a report about crashed Windows application.
- WhatIsHang — Get information about Windows software that stopped responding (hang)
- AppCrashView — View application crash information on Windows 7/Vista.
See Also
- NK2Edit — Edit, merge and fix the AutoComplete files (.NK2) of Microsoft Outlook.
Description
BlueScreenView scans all your minidump files created during ‘blue screen of death’ crashes, and displays the information about all crashes in one table.
For each crash, BlueScreenView displays the minidump filename, the date/time of the crash, the basic crash
information displayed in the blue screen (Bug Check Code and 4 parameters), and the details of the driver or module
that possibly caused the crash (filename, product name, file description, and file version).
For each crash displayed in the upper pane, you can view the details of the device drivers loaded during the crash in the lower pane.
BlueScreenView also mark the drivers that their addresses found in the crash stack, so you can easily locate the suspected drivers that possibly caused the crash.
Download links are on the bottom of this page
Versions History
- Version 1.55:
- Added Drag & Drop support: You can now drag a single MiniDump file from Explorer into the main window of BlueScreenView.
- Fixed bug: BlueScreenView failed to remember the last size/position of the main window if it was not located in the primary monitor.
- Version 1.52:
- Added ‘Google Search — Bug Check’ and ‘Google Search — Bug Check + Parameter 1’ options.
- Version 1.51:
- Added automatic secondary sorting (‘Crash Time’ column).
- Added 64-bit build.
- Version 1.50:
- The ‘Crash Time’ now displays more accurate date/time of the crash.
In previous versions, the value of ‘Crash Time’ column was taken from the date/time of dump file, which actually represents that time that Windows loaded again, after the crash.
The actual crash time is stored inside the dump file , and now the ‘Crash Time’ displays this value. - Added ‘Dump File Time’ column, which displays the modified time of the dump file.
- The ‘Crash Time’ now displays more accurate date/time of the crash.
- Version 1.47:
- Added ‘Auto Size Columns+Headers’ option, which allows you to automatically resize the columns according to the row values and column headers.
- Version 1.46:
- Fixed issue: The properties and the ‘Advanced Options’ windows opened in the wrong monitor, on multi-monitors system.
- Version 1.45:
- You can now choose to open only a specific dump file — from the user interface or from command-line.
- You can now also specify the MiniDump folder or MiniDump file as a single parameter, and BlueScreenView
will be opened with the right dump file/folder, for example:
BlueScreenView.exe C:\windows\minidump\Mini011209-01.dmp
- Version 1.40:
- Added ‘Raw Data’ mode on the lower pane, which displays the processor registers and memory hex dump.
- Version 1.35:
- Added ‘Crash Address’ column.
- Added 3 columns that display that last 3 calls found in the stack
(Only for 32-bit crashes)
- Version 1.32:
- Added ‘Mark Odd/Even Rows’ option, under the View menu. When it’s turned on, the odd and even rows are displayed in different color, to make it easier to read a single line.
- Version 1.31:
- Added ‘Google Search — Bug Check+Driver’ for searching in Google the driver name and bug check code of the selected blue screen.
- Version 1.30:
- Added ‘Dump File Size’ column.
- Version 1.29:
- You can now send the list of blue screen crashes to stdout by specifying an empty filename («») in the command-line of all save parameters.
For example: bluescreenview.exe /stab «» > c:\temp\blue_screens.txt
- You can now send the list of blue screen crashes to stdout by specifying an empty filename («») in the command-line of all save parameters.
- Version 1.28:
- Added ‘Add Header Line To CSV/Tab-Delimited File’ option. When this option is turned on, the column names are added
as the first line when you export to csv or tab-delimited file.
- Added ‘Add Header Line To CSV/Tab-Delimited File’ option. When this option is turned on, the column names are added
- Version 1.27:
- Fixed issue: removed the wrong encoding from the xml string, which caused problems to some xml viewers.
- Version 1.26:
- Fixed ‘DumpChk’ mode to work properly when DumpChk processing takes more than a few seconds.
- Version 1.25:
- Added ‘DumpChk’ mode, which displays the output of Microsoft DumpChk utility (DumpChk.exe).
You can set the right path and parameters of DumpChk in ‘Advanced Options’ window.
By default, BlueScreenView tries to run DumpChk from ‘%programfiles%\Debugging Tools for Windows’ - The default MiniDump folder is now taken from HKEY_LOCAL_MACHINE\SYSTEM\CurrentControlSet\Control\CrashControl
- Added ‘DumpChk’ mode, which displays the output of Microsoft DumpChk utility (DumpChk.exe).
- Version 1.20:
- Added 3 new columns in the upper pane: Processors Count, Major Version, Minor Version.
- Added ‘Explorer Copy’ option, which allows you to copy dump files to the clipboard and then paste them into Explorer window.
- Version 1.15:
- Added option to view the blue screen list of multiple computers on your network.
The computer names are specified in a simple text file. (See below). - Added Combo-Box to easily choose the MiniDump folders available in the hard-disks currently attached to your computer.
- Added ‘Computer Name’ and ‘Full Path’ columns.
- Added option to view the blue screen list of multiple computers on your network.
- Version 1.11:
- Added /sort command-line option.
- Version 1.10:
- Added accelerator keys for allowing you to toggle between modes more easily.
- Added command-line options for saving the crash dumps list to text/csv/html/xml file.
- Added command-line option for opening BlueScreenView with the desired MiniDump folder.
- Fixed focus problems when opening the ‘Advanced Options’ window.
- Added ‘default’ button to the ‘Advanced Options’ window.
- Added ‘processor’ column — 32-bit or x64.
- Version 1.05 — Added support for x64 MiniDump files.
- Version 1.00 — First release.
BlueScreenView Features
- Automatically scans your current minidump folder and displays the list of all crash dumps, including crash dump date/time and crash details.
- Allows you to view a blue screen which is very similar to the one that Windows displayed during the crash.
- BlueScreenView enumerates the memory addresses inside the stack of the crash, and find all drivers/modules that might be involved in the crash.
- BlueScreenView also allows you to work with another instance of Windows, simply by choosing the right minidump folder (In Advanced Options).
- BlueScreenView automatically locate the drivers appeared in the crash dump, and extract their version resource information, including product name, file version, company, and file description.
System Requirements
- BlueScreenView works with Windows XP, Windows Server 2003, Windows Server 2008, Windows Vista, Windows 7, Windows 8, Windows 10,
as long as Windows is configured to save minidump files during BSOD crashes.
If your system doesn’t create MiniDump files on a blue screen crash,
try to configure it according to the following article:
How to configure Windows to create MiniDump files on BSOD - BlueScreenView can read the MiniDump files of both 32-bit and x64 systems.
- Be aware that on Windows 10, some of the created MiniDump files might be empty and BlueScreenView will not display them.
Using BlueScreenView
BlueScreenView doesn’t require any installation process or additional dll files.
In order to start using it, simply run the executable file — BlueScreenView.exe
After running BlueScreenView, it automatically scans your MiniDump folder and display all crash details in the upper pane.
Crashes Information Columns (Upper Pane)
- Dump File: The MiniDump filename that stores the crash data.
- Crash Time: The created time of the MiniDump filename, which also matches to the date/time that the crash occurred.
- Bug Check String: The crash error string. This error string is determined according to the Bug Check Code, and it’s also displayed in the blue screen window of Windows.
- Bug Check Code: The bug check code, as displayed in the blue screen window.
- Parameter 1/2/3/4: The 4 crash parameters that are also displayed in the blue screen of death.
- Caused By Driver: The driver that probably caused this crash.
BlueScreenView tries to locate the right driver or module that caused the blue screen by looking inside the crash stack.
However, be aware that the driver detection mechanism is not 100% accurate, and you should also look in the lower pane, that display all drivers/modules found in the stack.
These drivers/modules are marked in pink color. - Caused By Address: Similar to ‘Caused By Driver’ column, but also display the relative address of the crash.
- File Description: The file description of the driver that probably caused this crash.
This information is loaded from the version resource of the driver. - Product Name: The product name of the driver that probably caused this crash.
This information is loaded from the version resource of the driver. - Company: The company name of the driver that probably caused this crash.
This information is loaded from the version resource of the driver. - File Version: The file version of the driver that probably caused this crash.
This information is loaded from the version resource of the driver. - Crash Address:The memory address that the crash occurred. (The address in the EIP/RIP processor register)
In some crashes, this value might be identical to ‘Caused By Address’ value, while in others,
the crash address is different from the driver that caused the crash. - Stack Address 1 — 3:
The last 3 addresses found in the call stack.
Be aware that in some crashes, these values will be empty.
Also, the stack addresses list is currently not supported for 64-bit crashes.
Drivers Information Columns (Lower Pane)
- Filename: The driver/module filename
- Address In Stack: The memory address of this driver that was found in the stack.
- From Address: First memory address of this driver.
- To Address: Last memory address of this driver.
- Size: Driver size in memory.
- Time Stamp: Time stamp of this driver.
- Time String: Time stamp of this driver, displayed in date/time format.
- Product Name: Product name of this driver, loaded from the version resource of the driver.
- File Description: File description of this driver, loaded from the version resource of the driver.
- File Version: File version of this driver, loaded from the version resource of the driver.
- Company: Company name of this driver, loaded from the version resource of the driver.
- Full Path: Full path of the driver filename.
Lower Pane Modes
Currently, the lower pane has 4 different display modes.
You can change the display mode of the lower pane from Options->Lower Pane Mode menu.
- All Drivers:
Displays all the drivers that were loaded during the crash that you selected in the upper pane.
The drivers/module that their memory addresses found in the stack, are marked in pink color. - Only Drivers Found In Stack:
Displays only the modules/drivers that their memory addresses found in the stack of the crash.
There is very high chance that one of the drivers in this list is the one that caused the crash. - Blue Screen in XP Style:
Displays a blue screen that looks very similar to the one that Windows displayed during the crash. - DumpChk Output:
Displays the output of Microsoft DumpChk utility.
This mode only works when Microsoft DumpChk is installed on your computer and
BlueScreenView is configured to run it from the right folder (In the Advanced Options window).
You can get DumpChk from the installation CD/DVD of Windows or
with the installtion of Debugging Tools for Windows.
Crashes of Remote Network Computer
If you have multiple computers on your network and you have full administrator access to them
(e.g: you have access to \\ComputerName\c$), you can also view the crashes of the other computers on your network remotely.
In order to do that, simply go to ‘Advanced Options’ (Ctrl+O) and type the MiniDump folder of the remote
computer, for example: \\MyComp\c$\Windows\MiniDump.
Notice: If you fail to get full administrator access to the remote computer, you should read the instructions in the following Blog post:
How to connect a remote Windows 7/Vista/XP computer with NirSoft utilities.
Watching the crashes of multiple computers on your network
If you have a network with multiple computers, and you have full admin access to these computers, you can
view the blue screens list of all these computers in one table, and easily detect computers with recurring BSOD problems.
In order to use this feature, prepare a list of all computer names/IP addresses that you want to inspect, and save it to a simple text file.
The computer names in the list can be delimited by comma, semicolon, tab character, or Enter (CRLF).
Example for computer names list:
comp01
comp02
192.168.0.1
192.168.0.2
192.168.0.4
After you have a text file contains the computers list, you can go to Advanced Options window (Ctrl+O), choose the second option and type the computers list filename.
Command-Line Options
| /LoadFrom <Source> |
Specifies the source to load from. 1 -> Load from a single MiniDump folder (/MiniDumpFolder parameter) 2 -> Load from all computers specified in the computer list file. (/ComputersFile parameter) 3 -> Load from a single MiniDump file (/SingleDumpFile parameter) |
| /MiniDumpFolder <Folder> | Start BlueScreenView with the specified MiniDump folder. |
| /SingleDumpFile <Filename> | Start BlueScreenView with the specified MiniDump file. (For using with /LoadFrom 3) |
| /ComputersFile <Filename> | Specifies the computers list filename. (When LoadFrom = 2) |
| /LowerPaneMode <1 — 3> |
Start BlueScreenView with the specified mode. 1 = All Drivers, 2 = Only Drivers Found In Stack, 3 = Blue Screen in XP Style. |
| /stext <Filename> | Save the list of blue screen crashes into a regular text file. |
| /stab <Filename> | Save the list of blue screen crashes into a tab-delimited text file. |
| /scomma <Filename> | Save the list of blue screen crashes into a comma-delimited text file (csv). |
| /stabular <Filename> | Save the list of blue screen crashes into a tabular text file. |
| /shtml <Filename> | Save the list of blue screen crashes into HTML file (Horizontal). |
| /sverhtml <Filename> | Save the list of blue screen crashes into HTML file (Vertical). |
| /sxml <Filename> | Save the list of blue screen crashes into XML file. |
| /sort <column> |
This command-line option can be used with other save options for sorting by the desired column. If you don’t specify this option, the list is sorted according to the last sort that you made from the user interface. The <column> parameter can specify the column index (0 for the first column, 1 for the second column, and so on) or the name of the column, like «Bug Check Code» and «Crash Time». You can specify the ‘~’ prefix character (e.g: «~Crash Time») if you want to sort in descending order. You can put multiple /sort in the command-line if you want to sort by multiple columns.
Examples: |
| /nosort | When you specify this command-line option, the list will be saved without any sorting. |
Translating BlueScreenView to other languages
In order to translate BlueScreenView to other language, follow the instructions below:
- Run BlueScreenView with /savelangfile parameter:
BlueScreenView.exe /savelangfile
A file named BlueScreenView_lng.ini will be created in the folder of BlueScreenView utility. - Open the created language file in Notepad or in any other text editor.
- Translate all string entries to the desired language.
Optionally, you can also add your name and/or a link to your Web site.
(TranslatorName and TranslatorURL values) If you add this information, it’ll be
used in the ‘About’ window. - After you finish the translation, Run BlueScreenView, and all translated
strings will be loaded from the language file.
If you want to run BlueScreenView without the translation, simply rename the language file, or move
it to another folder.
License
This utility is released as freeware.
You are allowed to freely distribute this utility via floppy disk, CD-ROM,
Internet, or in any other way, as long as you don’t charge anything for this.
If you distribute this utility, you must include all files in
the distribution package, without any modification !
Disclaimer
The software is provided «AS IS» without any warranty, either expressed or implied,
including, but not limited to, the implied warranties of merchantability and fitness
for a particular purpose. The author will not be liable for any special, incidental,
consequential or indirect damages due to loss of data or any other reason.
Feedback
If you have any problem, suggestion, comment, or you found a bug in my utility,
you can send a message to nirsofer@yahoo.com
BlueScreenView is also available in other languages. In order to change the language of
BlueScreenView, download the appropriate language zip file, extract the ‘bluescreenview_lng.ini’,
and put it in the same folder that you Installed BlueScreenView utility.
| Language | Translated By | Date | Version |
|---|---|---|---|
| Arabic | Fcmam5 | 23/02/2013 | 1.47 |
| Brazilian Portuguese | cslibraga | 20/02/2016 | 1.10 |
| Bulgarian | Евгений Кабакчиев | 05/06/2015 | 1.55 |
| Czech | Pavel Konečný | 04/01/2015 | 1.52 |
| Danish | Gustav Brock | 15/01/2011 | 1.30 |
| Dutch | Jan Verheijen | 03/02/2015 | 1.55 |
| Farsi | Hamed Babaei (ÍÇãÏ ÈÇÈÇíí) | 18/03/2014 | 1.52 |
| Finnish | S. J. Liimatainen | 03/06/2020 | 1.55 |
| French | EtoileFilante® Corp. | 24/08/2015 | 1.55 |
| French | Eric FICHOT | 27/07/2013 | 1.52 |
| French | xb70walkyrie [v. 1.55] | 31/07/2016 | |
| German | «Latino» auf WinTotal.de | 29/01/2015 | 1.55 |
| Greek | geogeo.gr | 11/10/2014 | 1.52 |
| Hungarian | Timinoun | 12/12/2022 | 1.55 |
| Italian | Roberto B.WSS | 14/05/2015 | 1.55 |
| Italian | Daniele Cultrera & bovirus | 01/04/2014 | 1.52 |
| Japanese | iLEƒÖEj | 17/07/2013 | 1.52 |
| Korean | J. K. Lee(Wave) | 04/02/2015 | 1.55 |
| Latvian | Nizaury | 15/01/2012 | 1.45 |
| Persian | Shadima.com | 26/04/2020 | 1.55 |
| Polish | Wojciech Sabaj | 25/06/2012 | 1.45 |
| Polish | Tomasz Janiszewski | 04/08/2009 | 1.00 |
| Romanian | Jaff (Oprea Nicolae) | 08/05/2015 | 1.55 |
| Russian | Dmitry Posunko && Dm.Yerokhin | 21/01/2016 | 1.55 |
| Simplified Chinese | CuiPlaY | 14/03/2013 | 1.47 |
| Simplified Chinese | EaiLFly | 28/01/2012 | 1.45 |
| Simplified Chinese | Edison Chen | 27/05/2014 | 1.52 |
| Slovak | Fero Fico | 29/01/2015 | 1.55 |
| Slovenian | Darko Kenda | 22/01/2014 | 1.52 |
| Spanish | Amadeo García Torrano | 07/05/2020 | 1.55 |
| Swedish | Bernt Janhäger | 06/08/2012 | 1.45 |
| Swedish | Tommy Kellerman | 29/03/2011 | 1.32 |
| Traditional Chinese | 發夢 King | 04/08/2009 | 1.00 |
| Traditional Chinese | 丹楓(虫二電氣診所) | 08/10/2013 | 1.52 |
| Turkish | Saner Apaydin | 16/03/2010 | 1.20 |
| Turkish | HARUN ARI | 16/09/2011 | 1.40 |
| Ukrainian | Lembergman, August 2017 | 19/08/2017 | 1.5.5.0 |
| Ukrainian | vmsoft77 | 20/11/2013 | 1.52 |
| Valencian | vjatv | 25/08/2009 | 1.05 |
При возникновении синих экранов BSoD Windows 11, 10 и другие версии системы создают дамп (снимок состояния) оперативной памяти, содержащий отладочную информацию, которую можно использовать для диагностики и определения причин сбоя. Функция обычно включена по умолчанию, но если дампы памяти не создаются, их можно включить: Как включить создание дампов памяти в Windows.
Подробным анализом дампов памяти занимаются разработчики, но и для рядового пользователя, столкнувшегося с синими экранами в Windows это может оказаться полезным: адреса в памяти ему ничего не дадут, но часто можно обнаружить имя файла приложения или драйвера, вызывающее сбой. Здесь помогут специальные программы для анализа дампов памяти, о которых и пойдёт речь далее.
WinDbg

У Майкрософт имеется собственный инструмент отладки и анализа дампов памяти — WinDbg (пока Preview). Скачать его для Windows 11 и Windows 10 можно из Microsoft Store, используя поиск в магазине приложений или прямую ссылку.
Пример простого анализа дампа памяти для обычного пользователя с целью выявления процесса, вызвавшего BSoD с помощью WinDbg:
- Запустите WinDbg от имени Администратора (правый клик по ярлыку в меню «Пуск» — «Запуск от имени администратора»).
- В главном меню программы выберите «Файл» — «Open dump File» и укажите путь к нужному мини-дампу, обычно находящемуся в папке C:\Windows\Minidump, нажмите кнопку «Open».

- Введите команду
!analyze -v
в поле ввода команд (либо нажмите по ссылке с командой в верхней панели WinDbg) и дождитесь завершения анализа.

- В панели «Command» в верхней части окна программы будет отображен результат анализа, где, при удаче, вы сможете найти информацию о том, каким процессом был инициирован сбой (PROCESS_NAME).
- Может быть информация о файле драйвера (.sys) в поле IMAGE_NAME и другая информация, позволяющая найти источник проблемы.


Далее полученную информацию можно использовать для того, чтобы найти, каким устройствам соответствуют драйверы в Интернете, выяснить назначение процессов вызвавших сбой, предпринять те или иные действия с целью их устранения.
BlueScreenView
BlueScreenView — очень простая утилита, которая позволяет выбрать файла дампа памяти в списке и посмотреть, какие файлы драйвера и процессы привели к сбою: в окне программы они будут выделены красным цветом.

Скачать BlueScreenView можно с официального сайта разработчика https://www.nirsoft.net/utils/blue_screen_view.html
WhoCrashed
Ещё одна программа для анализа дампов памяти — WhoCrashed. В бесплатной версии предоставляет не так много информации.
После нажатия кнопки «Analyze» имеющиеся дампы памяти анализируются, и на вкладке «Report» выводятся коды ошибок, а также текстовое описание на английском языке о том, что означает этот код и о возможных причинах сбоя.

Официальный сайт WhoCrashed https://www.resplendence.com/whocrashed, судя по всему, не открывается из РФ, но утилиту легко найти и скачать из сторонних источников.