
-
Page 1: Davis Instruments Vantage Pro2
V antage P r o2 C onsole Manual ™ F or V antage Pro2 & V antage P ro2 Plus W eather Stations ™™ Davis Instruments, 3465 Diablo A venue, Hayward, CA 94545 • 510-732-9229 • www.da visnet.com[…]
-
Page 2: Davis Instruments Vantage Pro2
V antage Pro 2 Console Manual Rev . C, November 19, 2004 Document Part Number: 07395.234 For V antage Pro2 Consoles # 6312 & 6312C And V antage Pro2 Weather S tations # 6152, 6152C, 6153, 6162, 6163 V antage Pro ® and V antage Pro2 ™ are trademarks of Davis Instruments Corp., Hayward, CA. © Davis Instruments Corp. 2004. All rights reserved.[…]
-
Page 3: Davis Instruments Vantage Pro2
i T able of Content s Welcome to Vantage Pro2™ ………………………………………………….. 1 Console Features ……………………………………………………………… 1 Vantage Pro Options ………………………………………………………… 2 Installing the Console ……………………………..[…]
-
Page 4: Davis Instruments Vantage Pro2
1 Chapter 1 W elcome to V ant age Pro2™ W elcome to your V antage Pro2 W eather Station console. The console dis- plays and records your station’ s weather data, provides graph and alarm functions, and interfaces to a comput er using our optio nal W eatherLink software. V antage Pro2 stations are available in two basic version s: Cabled and W i[…]
-
Page 5: Davis Instruments Vantage Pro2
Vantage Pro Options 2 Console Modes The console operates in five basic mo des: Setup, Current W eather , High s and Lows, Alarm, and Graph. Each mode lets you to access a different set of console functions or to display a different aspect of your weather data. V antage Pro Options Optional Sensors V antage Pro2 stations ar e extremely flexible. Us […]
-
Page 6: Davis Instruments Vantage Pro2
Vantage Pro Options 3 Optional Accessories The following accessories are availabl e from your deal er or may be ordered directly from Dav is Instruments. Sensor Mounting Shelf (#6672) Required for mounting the optional Solar Radiation and /or UV sensors. The mounting shelf attaches to the base of the rain collector on the ISS. Car/Boat/RV Lighter C[…]
-
Page 7: Davis Instruments Vantage Pro2
4 Chapter 2 Inst alling the Console The V antage Pro2 console is designed to give extremely accurate readings. As with any precision instrument, use care in its assembly and han dlin g. Although installing th e console is relatively simple, follo wing the steps outlined in this chapter and assembling the V antage Pro2 correctly from the start will […]
-
Page 8: Davis Instruments Vantage Pro2
Installing Batteries 5 3. Insert the power adapte r plug into the console power jack, t hen plug the other end of the adapter into an appropriate power outlet. 4. Check to make sure the console runs through a bri ef self-test procedure successfully . On power up, the consol e displays all the LCD segments and beeps twice. A message displays in the […]
-
Page 9: Davis Instruments Vantage Pro2
Console Location 6 2. Ensure that the ISS cable is not twisted through the access port. Note: The ISS must be assembled and connected to the console so that it is receiving power before the console connection can be tested. Once the console and ISS ar e both powered up, cable connection should be tested and established. Once the console is powered,[…]
-
Page 10: Davis Instruments Vantage Pro2
Console Location 7 • A void positioning a wireless console near large metallic surfaces such as refrigerators. T able & Shelf Placement The console kickstand can be set to three dif feren t angles all owing fiv e dif- ferent display angles. 1. Install the tw o rou nd rubber feet on the bottom of the console. Th e rubber feet help prevent dama[…]
-
Page 11: Davis Instruments Vantage Pro2
Console Location 8 W all Mounting The console mounts t o the wall using two keyholes located on the back of the case. T o mo unt the console on a wall: 1. Use a ruler to mark two mounting hole positions on the wall 8 inches (203 mm) apart. This is a representation for t he mounting hole positions. This template is not true to size. If installing a […]
-
Page 12: Davis Instruments Vantage Pro2
9 Chapter 3 Using Y our W e ather S tation The console LCD screen and ke yboard provide easy access to your weather information. The large LCD display shows current and past envi- ronmental conditions as well as a fo recast of future conditions. The key- board controls console functions for viewi ng current and historical weather information, setti[…]
-
Page 13: Davis Instruments Vantage Pro2
Setup Mode 10 • Exit Setup Mode by pressing and holding DONE until the Current W eather screen displays. Screen 1: Active T ransmitters Screen 1 displays the message “Receivi ng from…” and shows the transmit- ters being received by the console. In addition, an “X” blinks in the lower right-hand corner of the screen ev ery time the conso[…]
-
Page 14: Davis Instruments Vantage Pro2
Setup Mode 11 Screen 2: Configuring T ransmitter IDs — Wireless Only If you have a cabled stati on, press DO NE and see “Screen 4: Time & Date” on page 12. Setup screen 2 allows you to change the ISS transmitter ID and to add or remove optional transmitter stations. Th e default setting work s fine for most installations. The default tran[…]
-
Page 15: Davis Instruments Vantage Pro2
Setup Mode 12 on, the console becomes another transmitter that requires its own unique ID to transmit the data received from the ISS. Screen 3: Retrans mit 1. Press the up or down arrow to turn the retransmit function on and off. The first available transmitter ID not used by the ISS or any optio nal sensor is automatically assigned. Data from t he[…]
-
Page 16: Davis Instruments Vantage Pro2
Setup Mode 13 T o change the time and date: 1. Press the right and left arrows to se l ect the hou r, minute, month, day or year . The selected time or date setting blinks on and off. 2. T o change a setting, press the up and down arrows to adjust the value up or down. T o choose a 12-hou r or 24-h our clock, first select either the hour or minute […]
-
Page 17: Davis Instruments Vantage Pro2
Setup Mode 14 Screen 6: Longitude The console uses longitude along wit h latitude to determine y our location, allowing it to adjust the forecast and calculate the times for sunset and sun- rise. See Screen 5: Latitude for information on determ ining your latitude. Screen 6: Longitude • Longitude measures distance east or west of the Prime Meridi[…]
-
Page 18: Davis Instruments Vantage Pro2
Setup Mode 15 Note: UTC offset measures the difference bet ween the time in any time zone and a stan- dard time, set by convention as the time at the Royal Observatory in Greenwich, England. Hayward, California, the home of Davis Instruments, observes Pacific S tan- dard T ime. The UTC offset for Pacific S tandard Time is -8:00, or eight hours behi[…]
-
Page 19: Davis Instruments Vantage Pro2
Setup Mode 16 Screen 9: Daylight Savings S t atus Use this screen to either verify the correct automatic Daylight Savings sta- tus or to set Daylig ht Savings m anually . Screen 9: Dayligh t Savings Status 1. Press the up and down arrows to turn Daylight Savings Time on or of f on the appropriate days of the year , if Day Savings setting is MANUAL.[…]
-
Page 20: Davis Instruments Vantage Pro2
Setup Mode 17 1. Press the left and right arrows to mo ve from on e numeral in the elevation to another . 2. Press the up and down arrows t o adjust a numeral up or down. 3. T o switch between feet and me ters, press 2ND then press UNITS. 4. If you are below sea level, like in Death V alley or Palm Springs, first enter the elevation as a positive n[…]
-
Page 21: Davis Instruments Vantage Pro2
Setup Mode 18 Screen 12: Rain Collector The tipping bucket in the V antage Pro2 rain collector has been calibrated at the factory to measure 0.01» of rain with each tip. The ISS comes equipped with a metric adapter that, once instal led, takes 0.2 mm readings for every tip of the bu cket. Determine which measurement you want you r rai n […]
-
Page 22: Davis Instruments Vantage Pro2
Setup Mode 19 2. Press and release 2 ND and press UNITS once. The units used to display rain data toggle between inches and millimeters each time you repeat this key sequence. T o Display Rain in Metric Units in WeatherLink Refer to W eatherLink on line help for instructions to se t the rain collector to 0.2 mm and to select millimet e rs as the un[…]
-
Page 23: Davis Instruments Vantage Pro2
Current Weather Mode 20 Screen 14: Baud Ra te Note: The baud rate setting on your console must match the serial port setting in t he soft- ware on your computer . If you are using WeatherLink for V antage Pro2, refer to WeatherLink help for instructions on setting the serial port baud rate on your com- puter . 1. Press the up and down arrows to sel[…]
-
Page 24: Davis Instruments Vantage Pro2
Selecting Units of Measure 21 while most variables shar e their location with one or more variables. Y ou can select any variable not curren tly on the screen to display it. Selecting Weather V ariables Select a weather variable to display it’ s data on the screen if it isn’t alre ady visible or to graph the data available for that variable. W […]
-
Page 25: Davis Instruments Vantage Pro2
Selecting Units of Measure 22 T o change units: 1. Select the weather variable. See “Selecting W eather V ariables” on page 21. 2. Press and release 2ND then press UNITS. The selected variable’ s units will change. Repeat steps 1 and 2 until the desired units appear . For example, to change the Barometric pressure units, first select Ba ro- m[…]
-
Page 26: Davis Instruments Vantage Pro2
Selecting Units of Measure 23 sors readings display depends on your station configuration. T emperatures for temperat ure stations display , w ith soil temperature and moisture stations displayi ng consecutively . Humidity Press HUM to select outside hu midity . Pressing HUM a second time selects inside humidity . Humidity is displayed in percent r[…]
-
Page 27: Davis Instruments Vantage Pro2
Selecting Units of Measure 24 Pressure T rend The pressure trend arrow indicates the current barometric trend, measured over the last three hours. The pressure trend is updated every 15 minutes. The pressure tre nd requires three hours of data in order to be calculated so it won’t display right away on a new station. The pressure trend is always […]
-
Page 28: Davis Instruments Vantage Pro2
Selecting Units of Measure 25 Rain Rate Press RAINYR to display th e current rain rate. Rain Rate may be displayed as either inches per hour (in/hr) or millimeters per hour (mm/hr). Rain Rate will show zero and the umb rell a ic on does not appear until t wo tips of the rain bucket wit hin a 15–minute peri od. Month-to-date precipit ation Press R[…]
-
Page 29: Davis Instruments Vantage Pro2
Selecting Units of Measure 26 Solar Radi ation Press and release 2ND then press SOLAR to display th e current solar radiation reading. Solar radi atio n is dis- played as W atts per square meter (W/m 2 ). Current Evapotranspiration (ET) Press and release 2ND then press ET to display the cur- rent evapotranspirati on reading. Monthly Evapotranspirat[…]
-
Page 30: Davis Instruments Vantage Pro2
Displaying the Forecast 27 Displaying the Forecast Y our console generates a weather forecast based on the barometric reading & trend, wind speed & direction, rainfall, temperature, hum idi ty , latitude & longitude, and tim e of year . Included in the forecast is a prediction of the sky condition (sunny , cloudy , etc.) and changes in […]
-
Page 31: Davis Instruments Vantage Pro2
Calibrating, Setting, and Clearing Variables 28 1. Select a variable to be calibrated. See “Selecting W eather V ariables” on page 21. 2. Press and release 2ND, then press and hold SET . After a moment, the variable you’ve selected begi ns to blink. Keep holding SET unti l the Calibration Off- set message displays in the ticker . The ticker d[…]
-
Page 32: Davis Instruments Vantage Pro2
Calibrating, Setting, and Clearing Variables 29 Calibrating Barometric Pressure Before calibrating the barometri c pressure, be sure the stati on is set to the correct elevation. 1. Press BAR to select baro met ri c pressure. 2. Press and release 2ND, then press and hold SET . The pressure variable blinks. 3. Continue holding the key unti l the tic[…]
-
Page 33: Davis Instruments Vantage Pro2
Highs and Lows Mode 30 • Daily rain — Clearing t he daily rain value is reflected in the daily rain total, the last 15 minutes of rain, the last three hours of rain sent to the forecast algorithm, the um brella icon, and the monthly and yearly rain totals. Clear the daily rain total if the station acci dentally reco rded rain when the ISS was ins[…]
-
Page 34: Davis Instruments Vantage Pro2
Highs and Lows Mode 31 Weather Dat a Highs and Lows Viewing Highs and Lows 1. Press HI/LOW to enter the Highs and Lows mode. The DA Y and HIGHS icons light up and the station displays the highs for all visible fields. 2. Press the up and down arrows to sc roll b etween Day Highs, Day Lows, Month Highs, Month Lows, Y ear Highs and Y ear Lows. The HI[…]
-
Page 35: Davis Instruments Vantage Pro2
Alarm Mode 32 4. Use the console keys to select a different weather variable. The console’ s time display shows the time of the selected variable’ s high or low . 5. Press DONE to exit the Highs a nd Lows mode. The console s creen switches to the Current W eather mode. Alarm Mode The V a ntage Pro2 features more than 30 alarms that can be progr[…]
-
Page 36: Davis Instruments Vantage Pro2
Alarm Mode 33 Time The time alarm is a standard “alarm cl ock” alarm. It sounds for one minute at the set time. Make sure you choo se AM or PM, if you’re in 12-hour mode. UV Dose The UV dose alarm sounds when the accumulated UV dose has exceeded the dose you set. The UV dose alarm does not arm unless th e initi al UV dose for the day has been[…]
-
Page 37: Davis Instruments Vantage Pro2
Graph Mode 34 Y ou have cleared the alarm s etting. 4. Press DONE to exit Alarm Mode. Silencing Alarms 1. Press DONE to silence an alarm when it sounds. V antage Pro Station Alarms Graph Mode The V antage Pro2 console includes a powerful Graph Mode that allows you to view over 100 graphs o f different kinds right on the screen, all with- out connec[…]
-
Page 38: Davis Instruments Vantage Pro2
Graph Mode 35 Viewing Graphs Although the graphs available may va ry for each weather variable, you dis- play the graphs in the same way . 1. Press GR APH to ent er Graph Mode. Only the date, grap h, graph icon, and selected variable are visible. The rest of the screen is blank. 2. Select a variable to graph. V a lues for the each of the last 24 ho[…]
-
Page 39: Davis Instruments Vantage Pro2
Graph Mode 36 V iew graphs of all other variables the same way . 1. Select the variable you want to view . 2. Press G RAPH. 3. Use the left and right arrows to select dif ferent variables. 4. Press the up arrow to shorten the time range. 5. Press the down arrow to lengthen the time range. 6. Press HI/LOW to shift between highs an d low s. 7. Press […]
-
Page 40: Davis Instruments Vantage Pro2
37 Chapter 4 T roubleshooting and Maintenance V antage Pro2 T roubleshooting Guide While your V antage Pro2 weather station is designed to provide years of trouble-free operation, occasional probl ems may arise. If you are having a problem with your statio n, please cons ult this troubleshoo ting guide before calling Davis technical support. Y ou m[…]
-
Page 41: Davis Instruments Vantage Pro2
Vantage Pro2 Troubleshooting Guide 38 T roubleshooting Reception Problems While we have tested the W ireless V antage Pro2 radio extensively , each site and each installation presents it s own issues and challenges. Obstruc- tions, particularly metallic ones, will often cut down your station’ s recep- tion distance. Be sure to test receptio n bet[…]
-
Page 42: Davis Instruments Vantage Pro2
Console Diagnostic Screens 39 The console’ s reception status displays at the lower right corner of the screen. • An “X” flashes for every data p acket received by the console. • An “R” is shown when the console is trying to re-establish a lost con- nection. • An “L” is shown when the signal has been lost. • When no data packe[…]
-
Page 43: Davis Instruments Vantage Pro2
Console Diagnostic Screens 40 • Press the right arrow to display signal st atisti cs fo r the next installed transmitter ID. • Press HI/LOW to toggle Gain on and off. The message in the ticker indicates the current Ga in status. The Receiver Gain setting provides some control over the receiver sensitiv ity . If you’re having trouble with rece[…]
-
Page 44: Davis Instruments Vantage Pro2
Console Diagnostic Screens 41 5. Percentage of packets received wit hout errors. 6. T otal number of packets received. 7. Number of times the console resy nchronized with the tran smitter . 8. Maximum number of packets missed in a row without resynchroniza- tion. 9. Current number of consecutive misses. The counter increments when the console is sy[…]
-
Page 45: Davis Instruments Vantage Pro2
Console Maintenance 42 5. Current frequency correction factor . 6. Frequency index of the next packet to be received. 7. Current number of cons ecutive packets missed. 8. The number of times that the Phase Lock Loop did not lock. 9. Current streak of cons ecutive packets received. Console Firmware V ersions In some cases, the p roblem may be that y[…]
-
Page 46: Davis Instruments Vantage Pro2
43 Appendix A W eather Dat a Refer to this appendix to learn more about the weather variables that are measured, displayed, and logged by your V antage Pro2 Station. Some weather variables require opti onal sensor s. See “Optional Sensors” starting on page 2. Wind The anemometer measures wind speed and dir ection, and is part of the Integrated […]
-
Page 47: Davis Instruments Vantage Pro2
44 Note: V antage Pro2 measures Heat Index only when the air temperature is above 57° F (14° C), because it’s insignificant at lo wer temperatures. (Below 57°, Heat Index = the air temperature.) The Heat Index is not ca lculated above 135° F (52° C). T emperature/Humidity/Sun/Wind (THSW) Index The THSW Index uses humidity and temperature lik[…]
-
Page 48: Davis Instruments Vantage Pro2
45 Y ou can also use dew point to predic t t he minimum over night temperat ure. Provided no new fronts are expected overnigh t an d the afternoon Relative Humidity is greater than or equal to 50%, the afternoon’ s dew point gives you an idea of what mini mu m temperature to ex p ect overnight, since the air can never get colder than the dew poin[…]
-
Page 49: Davis Instruments Vantage Pro2
46 from the sun and the reflected compon ent from the rest of the sky . The solar radiation reading gives a measure of the am ount of solar radiation hit- ting the solar radiation sensor at any given tim e, expressed in W at ts/sq. meter (W/m 2 ). Solar r a diati on req uires the solar radiatio n sen sor . UV (Ultra Violet) Radiation Energy from th[…]
-
Page 50: Davis Instruments Vantage Pro2
47 UV Index V a ntage Pro2 can also di splay UV Index, an inte nsity measurem ent first defined by Environm ent Canada and since been adopted by the W orld Meteorological Organization. UV Index assigns a number between 0 and 16 to t he current UV i ntensity . The US EP A categorizes the Index values as shown in table A-3. The lo wer the number , th[…]
-
Page 51: Davis Instruments Vantage Pro2
48 Evapotranspiration (ET) Evapotranspiration (ET) is a measur ement of the am oun t of water vapor returned to the air in a given area. It combines the amount of water vapor returned through evaporation (from w et vegetation surfaces and the stoma of leaves) with the amount of water vapor returned through tran sp iration (exhaling of moisture thro[…]
-
Page 52: Davis Instruments Vantage Pro2
49 Appendix B S pecifications See complete specifications for your V antage Pro2 Station at our website: www .davisnet.com. Console Console Oper ating Temper ature . . . . . . . . +14° to +140°F (-10° to + 60°C) Display Temperat ure . . . . . . . . . . . . . . . . . +32° to +140° F (0° to +60°C) Non-oper ating Temper ature . . . . . . . . .[…]
-
Page 53: Davis Instruments Vantage Pro2
Console Data Display Specifications 50 Console Dat a Disp lay Specifications Historical Data . . . . . . . . . . . . . . . . . . . . . Includes the past 24 values listed u n- less otherwise noted; a ll can be cleared and a ll totals reset. Daily Data . . . . . . . . . . . . . . . . . . . . . . . . . Includes t he earlie st time of occur- rence of h[…]
-
Page 54: Davis Instruments Vantage Pro2
Weather Data Specifications 51 Weather Dat a Specifications Note: These specifications include optio nal sensors that may not be i nst alled in your V antage Pro2 Sta t i o n . Weather Da ta Specifications Variable Requir ed Sens ors Resolution Range Nominal Ac curacy (+/-) Barometric Pressure * Included in Console 0.01” H g; 0.1 m m; 0.1 hPa; 0.[…]
-
Page 55: Davis Instruments Vantage Pro2
Weather Data Specifications 52 Solar Radiation Solar sensor 1 W/m 2 0 to 1800 W/m 2 5% of full sca le Inside Temperature Included in Console 0.1 ° F; 0.1 ° C +32 ° to +1 40 ° F; 0 to +60 ° C 1 ° F; 0.5 ° C Outside Temperature *** ISS, Temp Station or Temp Hum Station 0.1 ° F; 0.1 ° C -40 ° to +150 ° F; -40 ° to +65 ° C 1 ° F; 0.5 ° C[…]
-
Page 56: Davis Instruments Vantage Pro2
53 V antage Pro2 Console Icons Console icons indicate weather conditions and special functions. Forecast Indicates the weather forec ast for the next 12 hours. Moon Phase Shows the current moon phase. Sequenc e sho wn fo r Nort hern Hemis phere. Reve rs e sequenc e fo r the Southern Hemisphere. Alarm Bell Flashes wh en an al arm is triggered. Also […]
-
Страница 1
V antage P r o2 C onsole Manual ™ F or V antage Pro2 & V antage P ro2 Plus W eather Stations ™™ Davis Instruments, 3465 Diablo A venue, Hayward, CA 94545 • 510-732-9229 • www.da visnet.com[…]
-
Страница 2
V antage Pro 2 Console Manual Rev . C, November 19, 2004 Document Part Number: 07395.234 For V antage Pro2 Consoles # 6312 & 6312C And V antage Pro2 Weather S tations # 6152, 6152C, 6153, 6162, 6163 V antage Pro ® and V antage Pro2 ™ are trademarks of Davis Instruments Corp., Hayward, CA. © Davis Instruments Corp. 2004. All rights reserved.[…]
-
Страница 3
i T able of Content s Welcome to Vantage Pro2™ ………………………………………………….. 1 Console Features ……………………………………………………………… 1 Vantage Pro Options ………………………………………………………… 2 Installing the Console ……………………………..[…]
-
Страница 4
1 Chapter 1 W elcome to V ant age Pro2™ W elcome to your V antage Pro2 W eather Station console. The console dis- plays and records your station’ s weather data, provides graph and alarm functions, and interfaces to a comput er using our optio nal W eatherLink software. V antage Pro2 stations are available in two basic version s: Cabled and W i[…]
-
Страница 5
Vantage Pro Options 2 Console Modes The console operates in five basic mo des: Setup, Current W eather , High s and Lows, Alarm, and Graph. Each mode lets you to access a different set of console functions or to display a different aspect of your weather data. V antage Pro Options Optional Sensors V antage Pro2 stations ar e extremely flexible. Us […]
-
Страница 6
Vantage Pro Options 3 Optional Accessories The following accessories are availabl e from your deal er or may be ordered directly from Dav is Instruments. Sensor Mounting Shelf (#6672) Required for mounting the optional Solar Radiation and /or UV sensors. The mounting shelf attaches to the base of the rain collector on the ISS. Car/Boat/RV Lighter C[…]
-
Страница 7
4 Chapter 2 Inst alling the Console The V antage Pro2 console is designed to give extremely accurate readings. As with any precision instrument, use care in its assembly and han dlin g. Although installing th e console is relatively simple, follo wing the steps outlined in this chapter and assembling the V antage Pro2 correctly from the start will […]
-
Страница 8
Installing Batteries 5 3. Insert the power adapte r plug into the console power jack, t hen plug the other end of the adapter into an appropriate power outlet. 4. Check to make sure the console runs through a bri ef self-test procedure successfully . On power up, the consol e displays all the LCD segments and beeps twice. A message displays in the […]
-
Страница 9
Console Location 6 2. Ensure that the ISS cable is not twisted through the access port. Note: The ISS must be assembled and connected to the console so that it is receiving power before the console connection can be tested. Once the console and ISS ar e both powered up, cable connection should be tested and established. Once the console is powered,[…]
-
Страница 10
Console Location 7 • A void positioning a wireless console near large metallic surfaces such as refrigerators. T able & Shelf Placement The console kickstand can be set to three dif feren t angles all owing fiv e dif- ferent display angles. 1. Install the tw o rou nd rubber feet on the bottom of the console. Th e rubber feet help prevent dama[…]
-
Страница 11
Console Location 8 W all Mounting The console mounts t o the wall using two keyholes located on the back of the case. T o mo unt the console on a wall: 1. Use a ruler to mark two mounting hole positions on the wall 8 inches (203 mm) apart. This is a representation for t he mounting hole positions. This template is not true to size. If installing a […]
-
Страница 12
9 Chapter 3 Using Y our W e ather S tation The console LCD screen and ke yboard provide easy access to your weather information. The large LCD display shows current and past envi- ronmental conditions as well as a fo recast of future conditions. The key- board controls console functions for viewi ng current and historical weather information, setti[…]
-
Страница 13
Setup Mode 10 • Exit Setup Mode by pressing and holding DONE until the Current W eather screen displays. Screen 1: Active T ransmitters Screen 1 displays the message “Receivi ng from…” and shows the transmit- ters being received by the console. In addition, an “X” blinks in the lower right-hand corner of the screen ev ery time the conso[…]
-
Страница 14
Setup Mode 11 Screen 2: Configuring T ransmitter IDs — Wireless Only If you have a cabled stati on, press DO NE and see “Screen 4: Time & Date” on page 12. Setup screen 2 allows you to change the ISS transmitter ID and to add or remove optional transmitter stations. Th e default setting work s fine for most installations. The default tran[…]
-
Страница 15
Setup Mode 12 on, the console becomes another transmitter that requires its own unique ID to transmit the data received from the ISS. Screen 3: Retrans mit 1. Press the up or down arrow to turn the retransmit function on and off. The first available transmitter ID not used by the ISS or any optio nal sensor is automatically assigned. Data from t he[…]
-
Страница 16
Setup Mode 13 T o change the time and date: 1. Press the right and left arrows to se l ect the hou r, minute, month, day or year . The selected time or date setting blinks on and off. 2. T o change a setting, press the up and down arrows to adjust the value up or down. T o choose a 12-hou r or 24-h our clock, first select either the hour or minute […]
-
Страница 17
Setup Mode 14 Screen 6: Longitude The console uses longitude along wit h latitude to determine y our location, allowing it to adjust the forecast and calculate the times for sunset and sun- rise. See Screen 5: Latitude for information on determ ining your latitude. Screen 6: Longitude • Longitude measures distance east or west of the Prime Meridi[…]
-
Страница 18
Setup Mode 15 Note: UTC offset measures the difference bet ween the time in any time zone and a stan- dard time, set by convention as the time at the Royal Observatory in Greenwich, England. Hayward, California, the home of Davis Instruments, observes Pacific S tan- dard T ime. The UTC offset for Pacific S tandard Time is -8:00, or eight hours behi[…]
-
Страница 19
Setup Mode 16 Screen 9: Daylight Savings S t atus Use this screen to either verify the correct automatic Daylight Savings sta- tus or to set Daylig ht Savings m anually . Screen 9: Dayligh t Savings Status 1. Press the up and down arrows to turn Daylight Savings Time on or of f on the appropriate days of the year , if Day Savings setting is MANUAL.[…]
-
Страница 20
Setup Mode 17 1. Press the left and right arrows to mo ve from on e numeral in the elevation to another . 2. Press the up and down arrows t o adjust a numeral up or down. 3. T o switch between feet and me ters, press 2ND then press UNITS. 4. If you are below sea level, like in Death V alley or Palm Springs, first enter the elevation as a positive n[…]
-
Страница 21
Setup Mode 18 Screen 12: Rain Collector The tipping bucket in the V antage Pro2 rain collector has been calibrated at the factory to measure 0.01» of rain with each tip. The ISS comes equipped with a metric adapter that, once instal led, takes 0.2 mm readings for every tip of the bu cket. Determine which measurement you want you r rai n […]
-
Страница 22
Setup Mode 19 2. Press and release 2 ND and press UNITS once. The units used to display rain data toggle between inches and millimeters each time you repeat this key sequence. T o Display Rain in Metric Units in WeatherLink Refer to W eatherLink on line help for instructions to se t the rain collector to 0.2 mm and to select millimet e rs as the un[…]
-
Страница 23
Current Weather Mode 20 Screen 14: Baud Ra te Note: The baud rate setting on your console must match the serial port setting in t he soft- ware on your computer . If you are using WeatherLink for V antage Pro2, refer to WeatherLink help for instructions on setting the serial port baud rate on your com- puter . 1. Press the up and down arrows to sel[…]
-
Страница 24
Selecting Units of Measure 21 while most variables shar e their location with one or more variables. Y ou can select any variable not curren tly on the screen to display it. Selecting Weather V ariables Select a weather variable to display it’ s data on the screen if it isn’t alre ady visible or to graph the data available for that variable. W […]
-
Страница 25
Selecting Units of Measure 22 T o change units: 1. Select the weather variable. See “Selecting W eather V ariables” on page 21. 2. Press and release 2ND then press UNITS. The selected variable’ s units will change. Repeat steps 1 and 2 until the desired units appear . For example, to change the Barometric pressure units, first select Ba ro- m[…]
-
Страница 26
Selecting Units of Measure 23 sors readings display depends on your station configuration. T emperatures for temperat ure stations display , w ith soil temperature and moisture stations displayi ng consecutively . Humidity Press HUM to select outside hu midity . Pressing HUM a second time selects inside humidity . Humidity is displayed in percent r[…]
-
Страница 27
Selecting Units of Measure 24 Pressure T rend The pressure trend arrow indicates the current barometric trend, measured over the last three hours. The pressure trend is updated every 15 minutes. The pressure tre nd requires three hours of data in order to be calculated so it won’t display right away on a new station. The pressure trend is always […]
-
Страница 28
Selecting Units of Measure 25 Rain Rate Press RAINYR to display th e current rain rate. Rain Rate may be displayed as either inches per hour (in/hr) or millimeters per hour (mm/hr). Rain Rate will show zero and the umb rell a ic on does not appear until t wo tips of the rain bucket wit hin a 15–minute peri od. Month-to-date precipit ation Press R[…]
-
Страница 29
Selecting Units of Measure 26 Solar Radi ation Press and release 2ND then press SOLAR to display th e current solar radiation reading. Solar radi atio n is dis- played as W atts per square meter (W/m 2 ). Current Evapotranspiration (ET) Press and release 2ND then press ET to display the cur- rent evapotranspirati on reading. Monthly Evapotranspirat[…]
-
Страница 30
Displaying the Forecast 27 Displaying the Forecast Y our console generates a weather forecast based on the barometric reading & trend, wind speed & direction, rainfall, temperature, hum idi ty , latitude & longitude, and tim e of year . Included in the forecast is a prediction of the sky condition (sunny , cloudy , etc.) and changes in […]
-
Страница 31
Calibrating, Setting, and Clearing Variables 28 1. Select a variable to be calibrated. See “Selecting W eather V ariables” on page 21. 2. Press and release 2ND, then press and hold SET . After a moment, the variable you’ve selected begi ns to blink. Keep holding SET unti l the Calibration Off- set message displays in the ticker . The ticker d[…]
-
Страница 32
Calibrating, Setting, and Clearing Variables 29 Calibrating Barometric Pressure Before calibrating the barometri c pressure, be sure the stati on is set to the correct elevation. 1. Press BAR to select baro met ri c pressure. 2. Press and release 2ND, then press and hold SET . The pressure variable blinks. 3. Continue holding the key unti l the tic[…]
-
Страница 33
Highs and Lows Mode 30 • Daily rain — Clearing t he daily rain value is reflected in the daily rain total, the last 15 minutes of rain, the last three hours of rain sent to the forecast algorithm, the um brella icon, and the monthly and yearly rain totals. Clear the daily rain total if the station acci dentally reco rded rain when the ISS was ins[…]
-
Страница 34
Highs and Lows Mode 31 Weather Dat a Highs and Lows Viewing Highs and Lows 1. Press HI/LOW to enter the Highs and Lows mode. The DA Y and HIGHS icons light up and the station displays the highs for all visible fields. 2. Press the up and down arrows to sc roll b etween Day Highs, Day Lows, Month Highs, Month Lows, Y ear Highs and Y ear Lows. The HI[…]
-
Страница 35
Alarm Mode 32 4. Use the console keys to select a different weather variable. The console’ s time display shows the time of the selected variable’ s high or low . 5. Press DONE to exit the Highs a nd Lows mode. The console s creen switches to the Current W eather mode. Alarm Mode The V a ntage Pro2 features more than 30 alarms that can be progr[…]
-
Страница 36
Alarm Mode 33 Time The time alarm is a standard “alarm cl ock” alarm. It sounds for one minute at the set time. Make sure you choo se AM or PM, if you’re in 12-hour mode. UV Dose The UV dose alarm sounds when the accumulated UV dose has exceeded the dose you set. The UV dose alarm does not arm unless th e initi al UV dose for the day has been[…]
-
Страница 37
Graph Mode 34 Y ou have cleared the alarm s etting. 4. Press DONE to exit Alarm Mode. Silencing Alarms 1. Press DONE to silence an alarm when it sounds. V antage Pro Station Alarms Graph Mode The V antage Pro2 console includes a powerful Graph Mode that allows you to view over 100 graphs o f different kinds right on the screen, all with- out connec[…]
-
Страница 38
Graph Mode 35 Viewing Graphs Although the graphs available may va ry for each weather variable, you dis- play the graphs in the same way . 1. Press GR APH to ent er Graph Mode. Only the date, grap h, graph icon, and selected variable are visible. The rest of the screen is blank. 2. Select a variable to graph. V a lues for the each of the last 24 ho[…]
-
Страница 39
Graph Mode 36 V iew graphs of all other variables the same way . 1. Select the variable you want to view . 2. Press G RAPH. 3. Use the left and right arrows to select dif ferent variables. 4. Press the up arrow to shorten the time range. 5. Press the down arrow to lengthen the time range. 6. Press HI/LOW to shift between highs an d low s. 7. Press […]
-
Страница 40
37 Chapter 4 T roubleshooting and Maintenance V antage Pro2 T roubleshooting Guide While your V antage Pro2 weather station is designed to provide years of trouble-free operation, occasional probl ems may arise. If you are having a problem with your statio n, please cons ult this troubleshoo ting guide before calling Davis technical support. Y ou m[…]
-
Страница 41
Vantage Pro2 Troubleshooting Guide 38 T roubleshooting Reception Problems While we have tested the W ireless V antage Pro2 radio extensively , each site and each installation presents it s own issues and challenges. Obstruc- tions, particularly metallic ones, will often cut down your station’ s recep- tion distance. Be sure to test receptio n bet[…]
-
Страница 42
Console Diagnostic Screens 39 The console’ s reception status displays at the lower right corner of the screen. • An “X” flashes for every data p acket received by the console. • An “R” is shown when the console is trying to re-establish a lost con- nection. • An “L” is shown when the signal has been lost. • When no data packe[…]
-
Страница 43
Console Diagnostic Screens 40 • Press the right arrow to display signal st atisti cs fo r the next installed transmitter ID. • Press HI/LOW to toggle Gain on and off. The message in the ticker indicates the current Ga in status. The Receiver Gain setting provides some control over the receiver sensitiv ity . If you’re having trouble with rece[…]
-
Страница 44
Console Diagnostic Screens 41 5. Percentage of packets received wit hout errors. 6. T otal number of packets received. 7. Number of times the console resy nchronized with the tran smitter . 8. Maximum number of packets missed in a row without resynchroniza- tion. 9. Current number of consecutive misses. The counter increments when the console is sy[…]
-
Страница 45
Console Maintenance 42 5. Current frequency correction factor . 6. Frequency index of the next packet to be received. 7. Current number of cons ecutive packets missed. 8. The number of times that the Phase Lock Loop did not lock. 9. Current streak of cons ecutive packets received. Console Firmware V ersions In some cases, the p roblem may be that y[…]
-
Страница 46
43 Appendix A W eather Dat a Refer to this appendix to learn more about the weather variables that are measured, displayed, and logged by your V antage Pro2 Station. Some weather variables require opti onal sensor s. See “Optional Sensors” starting on page 2. Wind The anemometer measures wind speed and dir ection, and is part of the Integrated […]
-
Страница 47
44 Note: V antage Pro2 measures Heat Index only when the air temperature is above 57° F (14° C), because it’s insignificant at lo wer temperatures. (Below 57°, Heat Index = the air temperature.) The Heat Index is not ca lculated above 135° F (52° C). T emperature/Humidity/Sun/Wind (THSW) Index The THSW Index uses humidity and temperature lik[…]
-
Страница 48
45 Y ou can also use dew point to predic t t he minimum over night temperat ure. Provided no new fronts are expected overnigh t an d the afternoon Relative Humidity is greater than or equal to 50%, the afternoon’ s dew point gives you an idea of what mini mu m temperature to ex p ect overnight, since the air can never get colder than the dew poin[…]
-
Страница 49
46 from the sun and the reflected compon ent from the rest of the sky . The solar radiation reading gives a measure of the am ount of solar radiation hit- ting the solar radiation sensor at any given tim e, expressed in W at ts/sq. meter (W/m 2 ). Solar r a diati on req uires the solar radiatio n sen sor . UV (Ultra Violet) Radiation Energy from th[…]
-
Страница 50
47 UV Index V a ntage Pro2 can also di splay UV Index, an inte nsity measurem ent first defined by Environm ent Canada and since been adopted by the W orld Meteorological Organization. UV Index assigns a number between 0 and 16 to t he current UV i ntensity . The US EP A categorizes the Index values as shown in table A-3. The lo wer the number , th[…]
-
Страница 51
48 Evapotranspiration (ET) Evapotranspiration (ET) is a measur ement of the am oun t of water vapor returned to the air in a given area. It combines the amount of water vapor returned through evaporation (from w et vegetation surfaces and the stoma of leaves) with the amount of water vapor returned through tran sp iration (exhaling of moisture thro[…]
-
Страница 52
49 Appendix B S pecifications See complete specifications for your V antage Pro2 Station at our website: www .davisnet.com. Console Console Oper ating Temper ature . . . . . . . . +14° to +140°F (-10° to + 60°C) Display Temperat ure . . . . . . . . . . . . . . . . . +32° to +140° F (0° to +60°C) Non-oper ating Temper ature . . . . . . . . .[…]
-
Страница 53
Console Data Display Specifications 50 Console Dat a Disp lay Specifications Historical Data . . . . . . . . . . . . . . . . . . . . . Includes the past 24 values listed u n- less otherwise noted; a ll can be cleared and a ll totals reset. Daily Data . . . . . . . . . . . . . . . . . . . . . . . . . Includes t he earlie st time of occur- rence of h[…]
-
Страница 54
Weather Data Specifications 51 Weather Dat a Specifications Note: These specifications include optio nal sensors that may not be i nst alled in your V antage Pro2 Sta t i o n . Weather Da ta Specifications Variable Requir ed Sens ors Resolution Range Nominal Ac curacy (+/-) Barometric Pressure * Included in Console 0.01” H g; 0.1 m m; 0.1 hPa; 0.[…]
-
Страница 55
Weather Data Specifications 52 Solar Radiation Solar sensor 1 W/m 2 0 to 1800 W/m 2 5% of full sca le Inside Temperature Included in Console 0.1 ° F; 0.1 ° C +32 ° to +1 40 ° F; 0 to +60 ° C 1 ° F; 0.5 ° C Outside Temperature *** ISS, Temp Station or Temp Hum Station 0.1 ° F; 0.1 ° C -40 ° to +150 ° F; -40 ° to +65 ° C 1 ° F; 0.5 ° C[…]
-
Страница 56
53 V antage Pro2 Console Icons Console icons indicate weather conditions and special functions. Forecast Indicates the weather forec ast for the next 12 hours. Moon Phase Shows the current moon phase. Sequenc e sho wn fo r Nort hern Hemis phere. Reve rs e sequenc e fo r the Southern Hemisphere. Alarm Bell Flashes wh en an al arm is triggered. Also […]

™
Vantage Pro2
Console Manual
For Vantage Pro2 & Vantage Pro2 Plus Weather Stations
Davis Instruments, 3465 Diablo Avenue, Hayward, CA 94545-2778 U.S.A. • 510-732-9229 • www.davisnet.com
™™
®
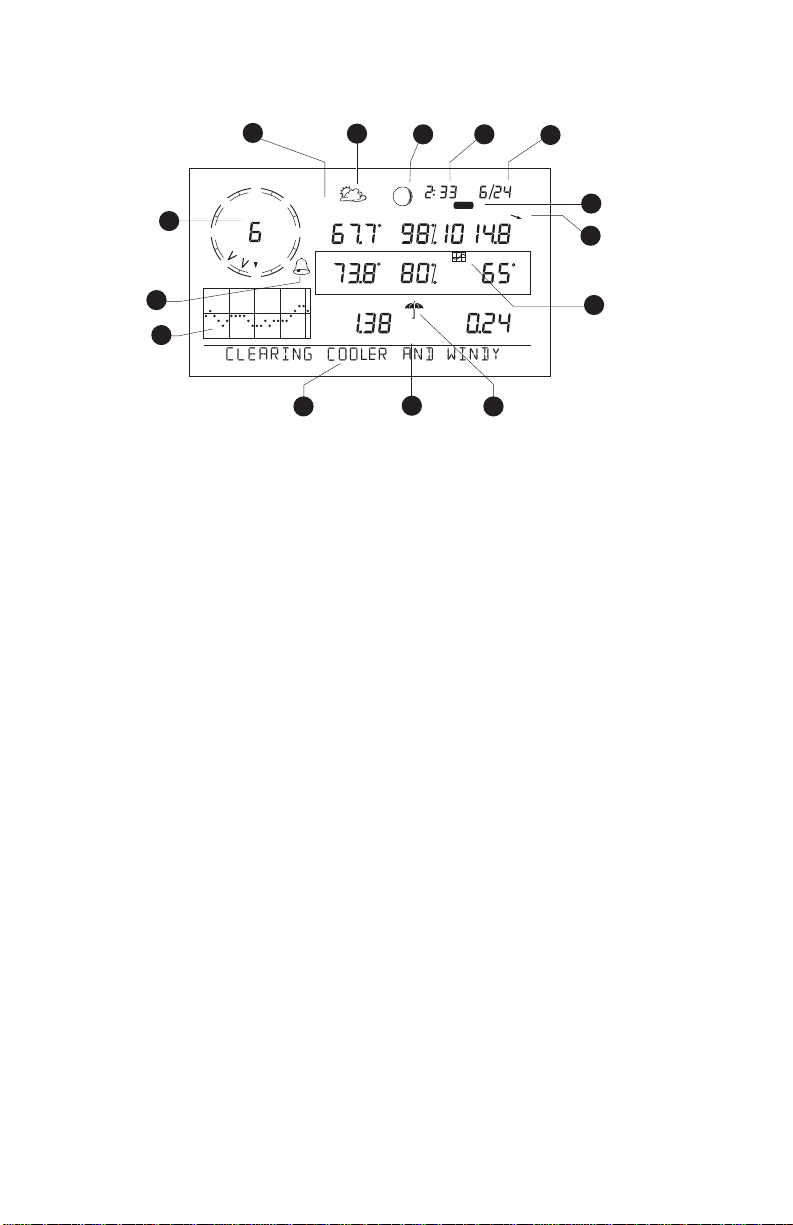
Vantage Pro2 Console Display Features
WIND
N
NW
1
WE
MPH
SW
Last 24 hrshrEvery 1
14
13
Vertical Scale: X10
32
NE
GRAPH
TEMP OUT
TEMP IN
SE
S
DAILY
F
F
in
STATION NO.1
HUM OUT
HUM IN
4
pm
2nd
BAROMETER
RAIN RATE
CHILL
5
hPa
F
in/hr
6
7
8
9
12
11
10
Display Features
1. Compass Rose
2. Graph & Hi/Low Mode Settings
3. Forecast Icons
4. Moon Phase Indicator
5. Time/Sunrise Time
6. Date/Sunset Date
7. 2ND Button Indicator
FCC Part 15 Class B Registration Warning
This equipment has been tested and found to comply with the limits for a Class B digital device, pursuant to Part
15 of the FCC Rules. These limits are designed to provide reasonable protection against harmful interference in a
residential installation. This equipment generates, uses, and can radiate radio frequency energy and, if not
installed and used in accordance with the instructions, may cause harmful interference to radio communications.
However, there is no guarantee that interference will not occur in a particular installation. If this equipment does
cause harmful interference to radio or television reception, which can be determined by turning the equipment on
and off, the user is encouraged to try to correct the interference by one or more of the following measures:
• Reorient or relocate the receiving antenna.
• Increase the separation between the equipment and receiver.
• Connect the equipment into an outlet on a circuit different from that to which the receiver is connected.
• Consult the dealer or an experienced radio/TV technician for help.
Changes or modification not expressly approved in writing by Davis Instruments may void the warranty and void
the user’s authority to operate this equipment.
FCC ID: IR2DWW6312
IC: 378810-6312
EC EMC Compliance
This product complies with the essential protection requirements of the EC EMC Directive 2004/108/EC; Low Voltage Directive 2006/95/EC; and Eco-Design Directive 2005/32EC > .05 watt no-load adaptor.
Vantage Pro2 Console Manual
Document Part Number: 07395.234 Rev. J, 2/14/11
For Vantage Pro2 Consoles # 6312 & 6312C
And Vantage Pro2 Weather Stations # 6152, 6152C, 6153, 6162, 6162C, 6163
®
Vantage Pro
and Vantage Pro2™ are trademarks of Davis Instruments Corp., Hayward, CA.
Windows® is a trademark of Microsoft Corporation in the US and other countries. Macintosh® is a
trademark of Apple, Inc. in the US and other countries.
© Davis Instruments Corp. 2011. All rights reserved.
Information in this document subject to change without notice.
Davis Instruments Quality Management System is ISO 9001 certified.
8. Barometric Trend Arrow
9. Graph Icon
10. Current Rain Icon
11. Station Number Indicator
12. Weather Ticker
13. Graph Field
14. Alarm Icon

Table of Contents
Welcome to Vantage Pro2TM ……………………………………………………………………………….1
Console Features …………………………………………………………………………………………. 1
Vantage Pro2 Options ………………………………………………………………………………….. 2
Installing the Console …………………………………………………………………………………………4
Powering the Console …………………………………………………………………………………..4
Installing the AC Power Adapter …………………………………………………………………… 4
Installing Batteries ……………………………………………………………………………………….5
Connecting Cabled Stations ………………………………………………………………………….. 5
Console Location …………………………………………………………………………………………6
Using Your Weather Station ………………………………………………………………………………..9
Setup Mode ………………………………………………………………………………………………… 9
Current Weather Mode ………………………………………………………………………………. 18
Selecting Units of Measure …………………………………………………………………………. 18
Displaying the Forecast ………………………………………………………………………………24
Displaying Time & Date or Sunrise & Sunset ……………………………………………….24
Calibrating, Setting, and Clearing Variables …………………………………………………. 25
Highs and Lows Mode ……………………………………………………………………………….. 27
Alarm Mode ……………………………………………………………………………………………… 28
Graph Mode ………………………………………………………………………………………………31
Troubleshooting and Maintenance ………………………………………………………………………34
Vantage Pro2 Troubleshooting Guide ………………………………………………………….. 34
Console Diagnostic Mode …………………………………………………………………………..36
Console Maintenance ………………………………………………………………………………… 40
One Year Limited Warranty ……………………………………………………………………….. 40
Appendix A Weather Data …………………………………………………………………………………41
Appendix B Specifications …………………………………………………………………………………47
Console Specifications ……………………………………………………………………………….47
Wireless Communication Specifications ………………………………………………………. 47
Console Data Display Specifications …………………………………………………………… 48
Weather Data Specifications ………………………………………………………………………. 49
Appendix C Wireless Repeater Configuration ………………………………………………………51
Vantage Pro2 Console Icons ………………………………………………………………………………53
i
Chapter 1
Welcome to Vantage Pro2
Welcome to your Vantage Pro2 Weather Station console. The console displays and
records your station’s weather data, provides graph and alarm functions, and interfaces
to a computer using our optional WeatherLink
Vantage Pro2 stations are available in two basic versions: cabled and wireless. A
cabled Vantage Pro2 station transmits outside sensor data from the Integrated Sensor
Suite (ISS) to the console using a straight-through four-conductor cable. A wireless
Vantage Pro2 station transmits outside sensor data from the ISS to the console via a
low-power radio.
Note: Wireless consoles can also collect data from optional Vantage Pro2 sensors or a
Davis Vantage Vue ISS, and can also retransmit data to other Vantage Pro2 or Vantage Vue consoles or a Davis Weather Envoy. You can have an unlimited number of
consoles — one in each room!
The Vantage Pro2 Quick Reference Guide included with your station provides an easy
to use reference for most console functions.
®
TM
software.
Console Features
Keyboard & Display
The keyboard lets you view current and historical data, set and clear alarms, change
station models, enter calibration numbers, set up and view graphs, select sensors, and
read the forecast. The keyboard consists of 12 command keys located next to the screen
display and four navigation keys located below the command keys.
A weather variable or console command is printed on each command key.
Just press a key to select the variable or function printed on that key.
Each command key also has a secondary function which is printed above
the key on the console case. To select the secondary function, press and
release 2ND (on the front of the console, upper right corner) and then
immediately press the key for that function.
After pressing 2ND, the 2ND icon displays above the barometer reading on the screen
for three seconds. All secondary key functions are enabled during this time. Keys
resume normal operation after the icon disappears.
The+ and — navigation keys, along with < and > navigation keys are used
to select command options, adjust values, and to provide additional functions when used in combination with a command key.
CHILL
WIND
2
+
<
ND
>
—
1
Console Modes
The console operates in five basic modes: Setup, Current Weather, Highs and
Lows, Alarm, and Graph. Each mode lets you access a different set of console
functions or display a different aspect of your weather data.
Vantage Pro2 Options
Optional Sensors & Transmitting Stations
Vantage Pro2 stations are extremely flexible. Use the following optional sensors
and wireless stations to enhance the weather monitoring capabilities of your Vantage Pro2. See our web site for complete details:
www.davisnet.com.
Optional Sensor and Stations Description
Anemometer/Sensor Transmitter
Kit (#6332)
Vantage Connect (#6620)
Wireless Leaf & Soil Moisture/
Temperature Station (#6345)
Wireless Temperature Station
(#6372)
Wireless Temperature/Humidity
Station (#6382)
Solar Radiation Sensor (#6450)
Ultraviolet (UV) Radiation Sensor
(#6490)
Vantage Pro2 Options
Provides more flexible anemometer placement for wireless
stations. With Envoy8X, allows additional solar radiation,
UV, temperature, rain or 3rd party (reporting 0-3 volt)
sensors.
Transmits data from remote ISS to WeatherLink.com via
cellular connection.
Measures and transmits leaf wetness, soil moisture and
temperature data. Also for use with GLOBE.
Measures and transmits temperature data.
Measures and transmits air temperature and humidity
data.
Measures solar radiation. Required for calculating
evapotranspiration (ET). Available for cabled and wireless
stations. Requires Sensor Mounting Shelf (#6673).
Measures UV radiation. Required for calculating the UV
dose. Available for Cabled and Wireless stations. Requires
Sensor Mounting Shelf (#6673).
Note: Optional wireless stations can only be used with Wireless Vantage Pro2 Stations.
Optional WeatherLink® Software
The WeatherLink software and data logger connect your Vantage Pro2 station
directly to a computer, providing enhanced weather monitoring capabilities, a continuous preserved data record, and powerful Internet features. The WeatherLink
data logger fits neatly on the console and stores weather data even when the com-
puter is turned off.
WeatherLink Option Description
WeatherLink for Windows, USB
connection (#6510USB)
WeatherLink for Windows, serial
connection (#6510SER)
WeatherLink for Macintosh OS
X, USB connection (#6520)
WeatherLinkIP for Windows XP/
Vista/7 (#6555)
Includes WeatherLink software and USB data logger. Allows you
to save and view your weather data on your PC.
Includes WeatherLink software and serial data logger. Allows
you to save and view your weather data on your PC.
Includes WeatherLink software and USB data logger. Allows you
to save and view your weather data on your Mac.
Requires a broadband router with available Ethernet port. Allows
you to post your weather data directly to the Internet without a
PC. Among other features, allows you to receive e-mail alerts of
current weather conditions or simple alarm conditions.
2
Vantage Pro2 Options
WeatherLink Option Description
WeatherLink for APRS,
Windows version, with
streaming data logger, serial
connection (#6540)
WeatherLink for Alarm Output,
for Windows, with streaming
data logger, serial connection
(#6544)
WeatherLink for Emergency
Response teams, Windows
version, with streaming data
logger, serial connection
(#6550)
WeatherLink for Irrigation
Control, Windows version, with
streaming data logger, serial
connection
(#6560)
Includes WeatherLink software and streaming serial data logger.
Allows real-time display of current weather conditions for use
with APRS (Automatic Position Reporting System), for HAM
radio users.
Includes WeatherLink software and streaming serial data logger.
Gives you the ability to control external devices based on various
combinations of weather trends and events.
Includes WeatherLink software and streaming serial data logger.
Allows real-time display of current weather conditions for use by
emergency response teams.
Includes WeatherLink software and streaming serial data logger.
Allows intelligent and efficient control of popular automated
irrigation systems using weather data.
Optional Accessories
Accessories are available from your dealer or may be ordered directly from Davis
Instruments.
Envoys: Wireless Weather Envoy (#6316,) Envoy8X (#6318)
Performs many of the same functions as a Vantage Pro2 console, but without a display.
Use an Envoy to interface your wireless station to a computer, freeing the display for
use elsewhere. Weather Envoy can receive the same number and combinations of stations as a Vantage Pro2 console; Envoy8X can receive up to 8 stations in any combination and create a large database.
Sensor Mounting Shelf (#6673)
Required for mounting the optional Solar Radiation and/or UV sensors. The mounting
shelf attaches to the base of the rain collector on the ISS.
Additional Vantage Pro2 (#6312) or Vantage Vue Console (#6351)
Enjoy weather information in several rooms.
USB-to-Serial (DB-9) Cable (#8434)
Allows the Serial version of WeatherLink (#6510SER, 6540, 6550, 6560) to connect to
a USB port on your computer.
Telephone Modem Adapter (#6533)
Required when connecting station to an external phone modem.
Extension Cables (#7876)
Allows you to place the Cabled Vantage Pro2 ISS further away from the console using
the extension cable provided by Davis Instruments. Maximum cable length is 1000’
feet (300 m).
• #7876-040 Cable, 40’ (12 m)
• #7876-100 Cable, 100’ (30 m)
• #7876-200 Cable, 200’ (61 m)
3
Chapter 2
Installing the Console
The Vantage Pro2 console is designed to give extremely accurate readings. As with any
precision instrument, use care in its assembly and handling. Although installing the
console is relatively simple, following the steps outlined in this chapter and assembling
the Vantage Pro2 correctly from the start will help ensure that you enjoy all of its features with a minimum of time and effort.
Powering the Console
Cabled Vantage Pro2 Stations
Cabled Vantage Pro2 consoles supply power to the Integrated Sensor Suite (ISS)
through the console cable. Because of the added power consumption of the ISS, the
cabled console requires an AC power adapter used as the main power supply. The console batteries provide backup power for up to four to six weeks.
Wireless Vantage Pro2 Stations
Wireless Vantage Pro2 consoles do not require the use of an AC adapter. You may use
the included adapter if you wish, but the three C-cell batteries should power a wireless
console for up to nine months.
Note: When using an AC Power adapter, be sure to use the power adapter supplied with
your Vantage Pro2 Console. Your console may be damaged by connecting the
wrong power adapter. The console does not recharge the batteries. Because of this,
and because NiCad batteries do not power the console as long as alkaline batteries,
use alkaline batteries in the console.
Installing the AC Power Adapter
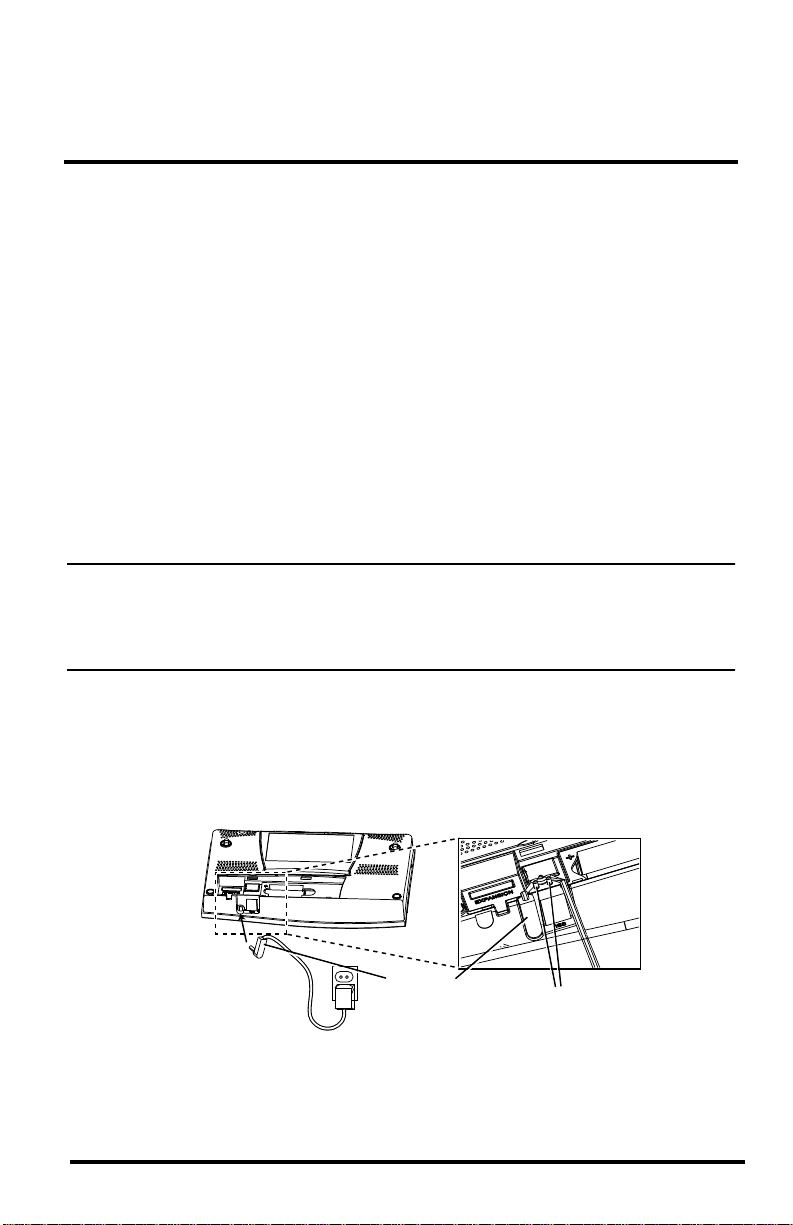
1. Remove the battery cover located on the back of the console by pressing down on
the two latches at the top of the cover.
2. Find the power jack located on the bottom of the console case.
Power Plug
3. Insert the power adapter plug into the console power jack, then plug the other end of
the adapter into an appropriate power outlet.
Wrap Cord Around Pins
4
Installing Batteries
4. Check to make sure the console runs through a brief self-test procedure successfully.
On power up, the console displays all the LCD segments and beeps twice. A message displays in the ticker banner at the bottom of the console, followed by the first
screen that displays during Setup Mode. Press and hold DONE to skip the message
and enter into Setup Mode.
Setup Mode guides you through steps required to configure the station. See “Setup
Mode” on page 9 for more information.
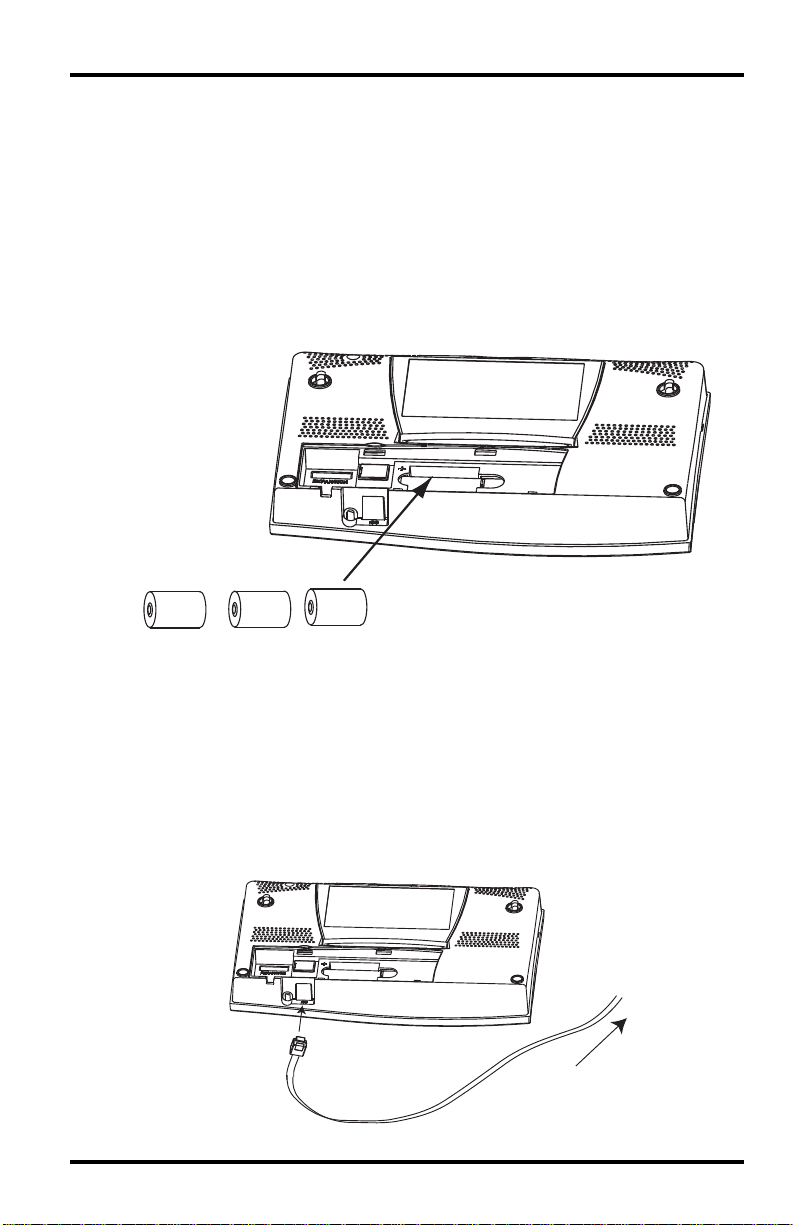
Installing Batteries
1. Remove the battery cover located on the back of the console by pressing down on
the two latches at the top of the cover.
Battery
Battery
Battery
2. Insert three C batteries into the battery channel, negative (or flat) terminal first.
3. Replace the battery cover.
Connecting Cabled Stations
Cabled Vantage Pro2 stations come with 100 feet (30m) of cable. This cable is used for
connecting the console to the ISS. Maximum cable length from ISS to the console
using Davis Instruments cables is 1000 feet. To connect the console to the ISS:
1. Firmly insert the console end of the straight-through four-conductor wire into the
console receptacle marked “ISS” until it clicks into place. Do not force the
connector into the receptacle.
To ISS
5
Console Location
2. Ensure that the ISS cable is not twisted through the access port.
Note: The ISS must be assembled and connected to the console so that it is receiving
power before the console connection can be tested.
Once the console and ISS are both powered up, cable connection should be tested and
established.
Once the console is powered, it automatically enters Setup Mode. You can step through
the Setup Mode options, or exit the Setup Mode to test the connection and sensor readings in Current Weather Mode. See “Setup Mode” on page 9 for Setup Mode options.
See “Current Weather Mode” on page 18 for viewing and verifying current weather
data coming from the cabled console.
To verify that the console is receiving data from the ISS through the console connection, see “Cabled ISS Assembly” in the Integrated Sensor Suite Installation Manual.
Console Location
Place the console in a location where the keyboard is easily accessible and the display
is easy to read. For more accurate readings:
• Avoid placing the console in direct sunlight. This may cause erroneous inside tem-
perature and humidity readings and may damage the unit.
• Avoid placing the console near radiators or heating/air conditioning ducts.
• If you are mounting the console on a wall, choose an interior wall. Avoid exterior
walls that tend to heat up or cool down depending on the weather.
• If you have a wireless console, be aware of possible interference from cordless
phones or other devices. To prevent interference, maintain a distance of 10 feet
between the Vantage Pro2 console and a cordless phone (handset and base).
• Avoid positioning a wireless console near large metallic appliances such as refrig-
erators, televisions, heaters, or air conditioners.
• The console antenna does not rotate in a complete circle. Avoid forcing the console
antenna when rotating it.
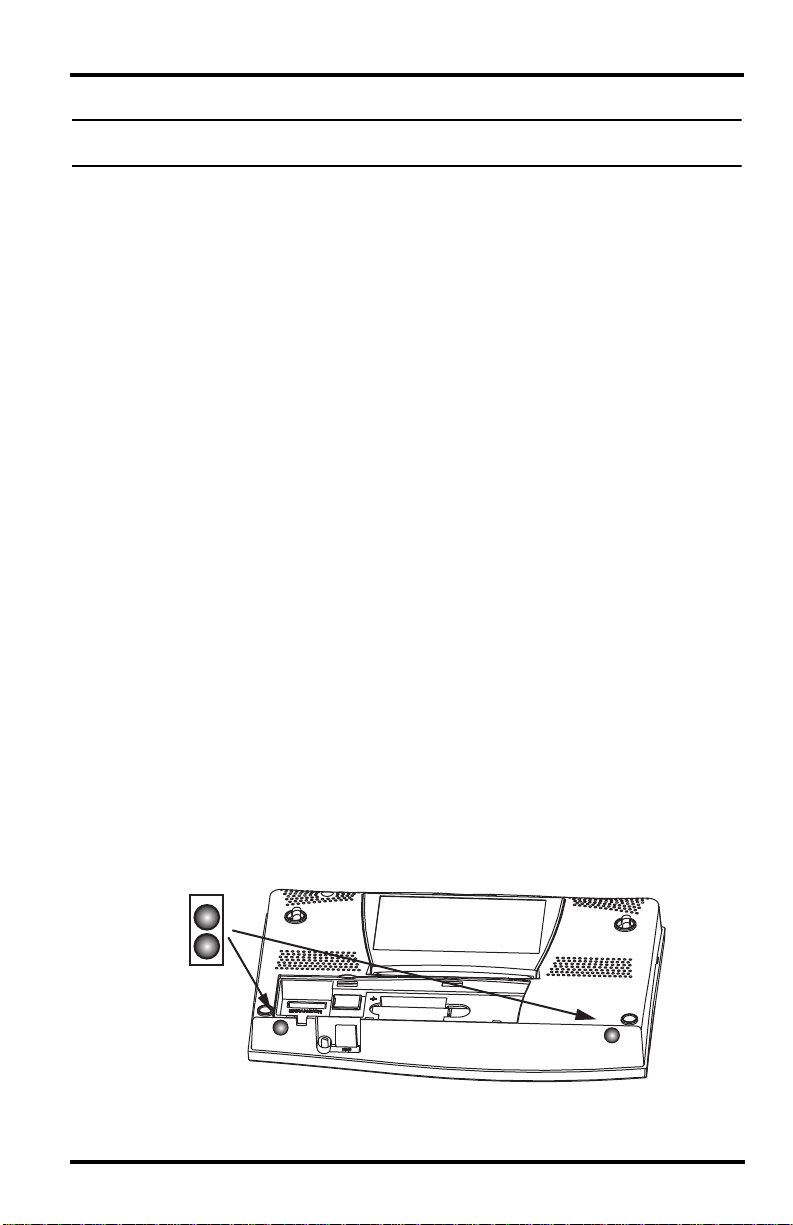
Table & Shelf Placement
The console kickstand can be set to three different angles allowing five different display angles.
1. Install the two round rubber feet on the bottom of the console. The rubber feet help
prevent damage to furniture and surfaces.
6
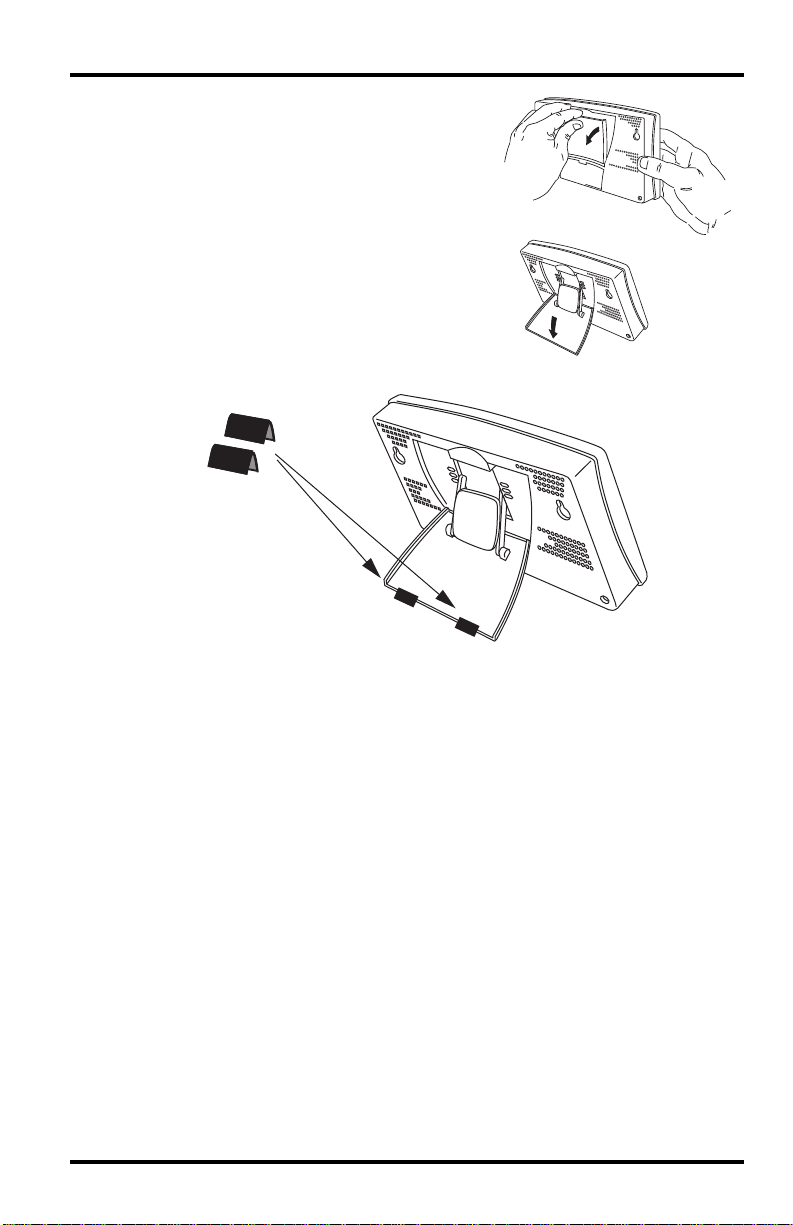
Console Location
2. Lean the kickstand out by pulling on its top
edge.
You’ll see the indentation for your finger at the
top edge of the console.
3. Slide the catch to rest the kickstand in the appropriate angle.
Choose low angles for display on a coffee table
or other low area. Choose higher angles for display on a desk or shelf.
4. Install the two rubber channel feet on the kickstand.
If necessary, pull up on the stand to close it. It will be a little tight, so it’s okay to push
hard enough to get it to slide.
7
Console Location
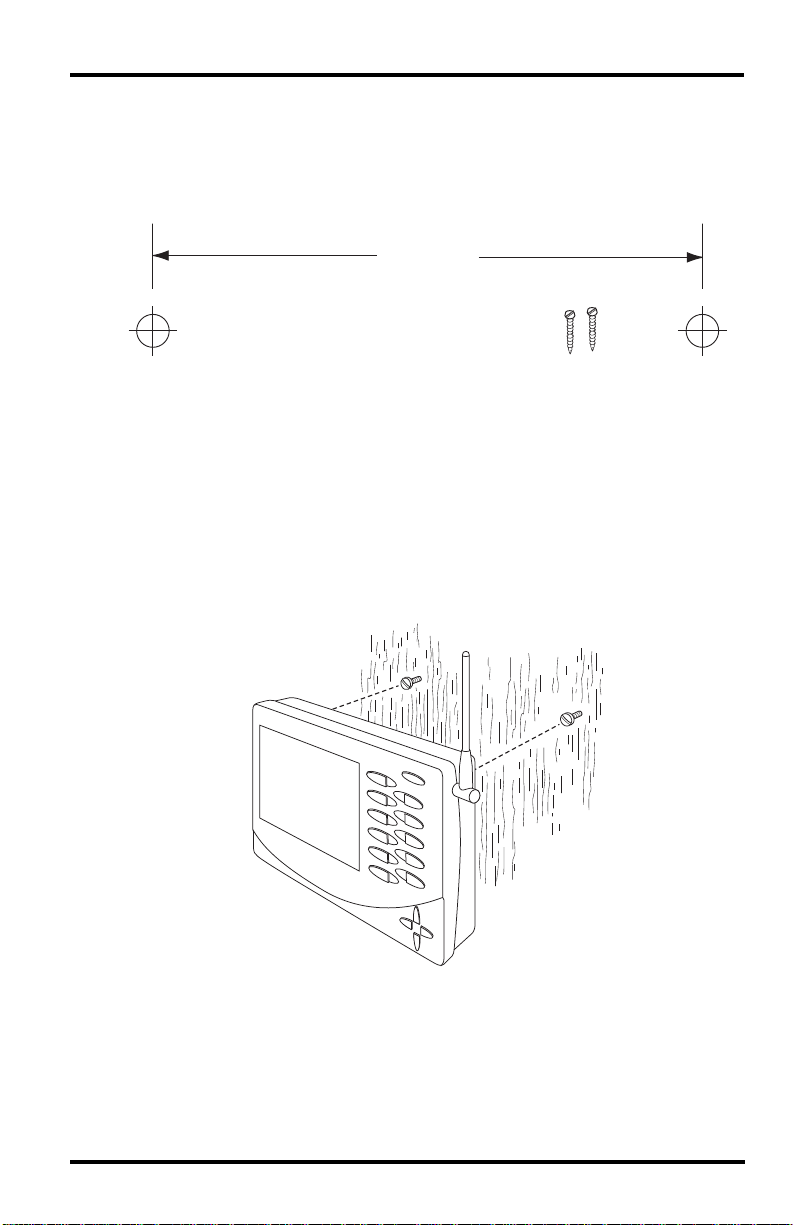
Wall Mounting
The console mounts to the wall using two keyholes located on the back of the case.
To mount the console on a wall:
1. Use a ruler to mark two mounting hole positions on the wall 8 inches (203 mm)
apart.
8″ (203mm)
Drill two 3/32″ or 7/64″ (2.4 to 2.8mm) holes
8″ (203mm) apart for the #6 x 1″ mounting screws.
This is a representation for the mounting hole positions. This template is not true to size.
If installing a cabled Vantage Pro2 console with sensor cable running inside the
wall, mount the console over an empty switch box.
2. Use a drill and a 3/32 or 7/64»(2.5 mm) drill bit to drill two pilot holes for the
screws.
3. Using a screwdriver, drive the two #6 x 1» pan head self-threading screws into the
wall. Leave at least 1/8» (3 mm) between the wall and the heads of the screws.
4. If the kickstand has been pulled out from the case, push it back into its upright and
locked position.
5. Guide the two keyholes on the back of the console over the two screws.
8
Chapter 3
Using Your Weather Station
The console LCD screen and keyboard provide easy access to your weather information. The large LCD display shows current and past environmental conditions as well
as a forecast of future conditions. The keyboard controls console functions for viewing
current and historical weather information, setting and clearing alarms, changing stations types, viewing and/or changing station settings, setting up and viewing graphs,
selecting sensors, getting the forecast, and so on.
Console Modes
The Vantage Pro2 console operates in five different modes:
Mode Description
Setup
Current Weather
High/Low High/Low Mode displays the daily, monthly or yearly high and low readings.
Alarm Alarm Mode allows you to set, clear, and review alarm settings.
Graph Graph Mode displays your weather data using over 100 different graphs.
Setup Mode
Setup Mode provides access to the station configuration settings that control how the
station operates. Setup Mode consists of a series of screens for selecting console and
weather station options. The screens that display in Setup Mode vary depending on the
weather station type (cabled or wireless), or if the console has a WeatherLink connection already established. (See the WeatherLink Getting Started Guide for more information on connecting your console to your computer.)
Setup Mode Commands
Setup Mode displays when the console is first powered. This mode can be displayed at
any time to change any of the console/weather station options. Use the following commands to enter, exit and navigate Setup Mode:
• Enter Setup Mode by pressing DONE and the — key at the same time.
Use Setup Mode to enter the time, date, and other information required to
calculate and display weather data.
Use Current Weather Mode to read the current weather information,
change measurement units, and to set, clear or calibrate weather readings.
Note: The console automatically enters Setup Mode when first powered.
• Press DONE to move to the next screen in the Setup Mode.
• Press BAR to display the previous screen in the Setup Mode.
• Exit Setup Mode by pressing and holding DONE until the Current Weather screen
displays.
9
Setup Mode
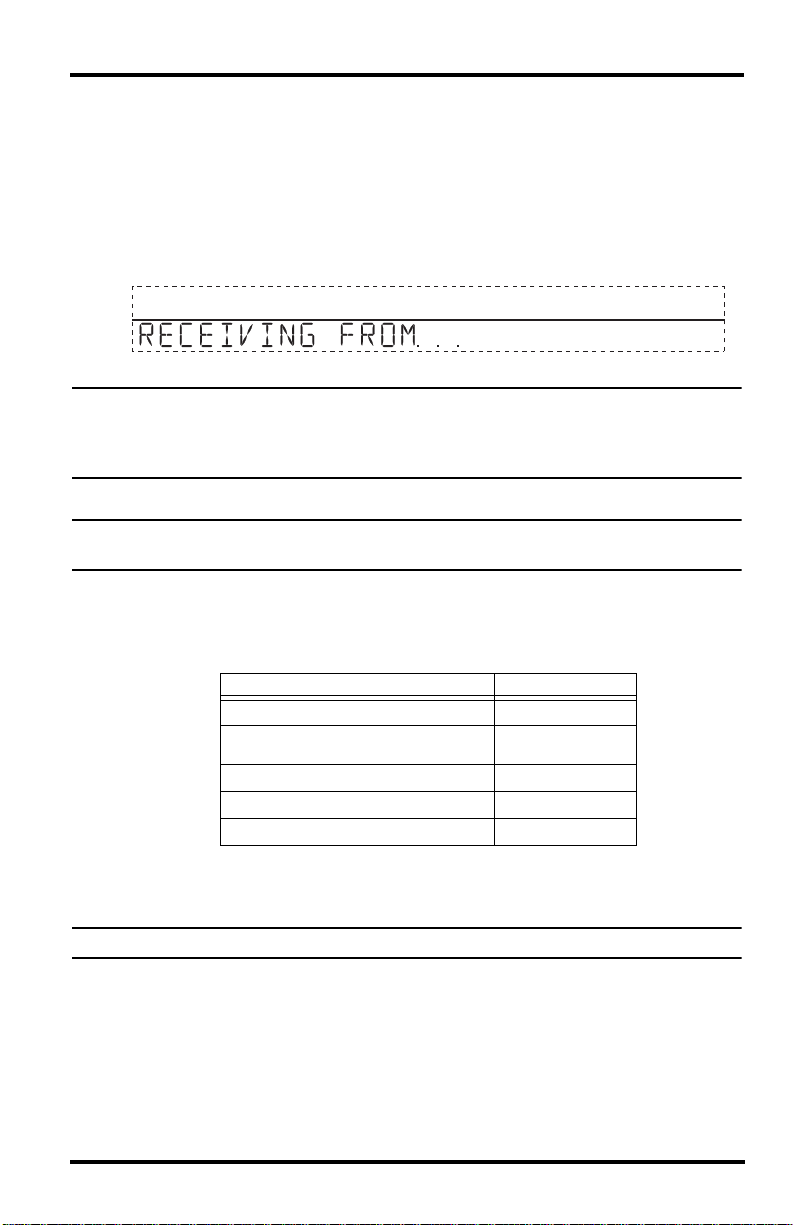
Screen 1: Active Transmitters
Screen 1 displays the message “Receiving from…” and shows the transmitters being
received by the console. In addition, an “X” blinks in the lower right-hand corner of the
screen every time the console receives a data packet from a station. The rest of the LCD
screen is blank.
If you have a cabled station, or if your wireless ISS uses the factory settings and you are
receiving the signal, the screen displays “Receiving from station No. 1.” Any optional
stations that have been installed should also display.
STATION NO.1
Screen 1: Active Transmitters
Note: An ISS or optional station must be powered for the console to recognize it. Refer to
the Integrated Sensor Suite Installation Manual or optional station installation instruc-
tions for more information. It make take several minutes for the console to acquire
and display a Transmitter ID.
4
1. Make a note of the station number(s) listed on the screen.
Note: If a Vantage Pro2 or Vantage Vue ISS has been installed in your area, its ID number
may also be displayed.
2. Press DONE to move to the next screen.
The console can receive signals from up to eight transmitters total, but there is a limit
on the number of certain types of transmitters. The table below lists the maximum number of stations allowable for a receiver:
Station Type Maximum Number
Integrated Sensor Suite (ISS)
Anemometer Transmitter Kit (replaces
ISS anemometer)
Leaf & Soil Moisture/Temperature Station
Temperature Station
Temperature/Humidity Station
*Two are allowable only if both stations are only partially populated. For example, A network can either
have both a Leaf Wetness/Temperature station and a Soil Moisture/Temperature station, or it can
have one combined Leaf Wetness and Soil Moisture/Temperature station.
Note: Listening to more than one transmitter may reduce battery life significantly.
Maximum Number of Transmitters in a Network with One Receiver
1
1
2*
8
8
Screen 2: Configuring Transmitter IDs — Wireless Only
(If you have a cabled station, press DONE and continue on to “Screen 4: Time & Date”
on page 12.)
Setup screen 2 allows you to change the ISS transmitter ID and to add or remove
optional transmitter stations. The default transmitter ID setting is “1” (ISS), which
works fine for most installations.
10
Setup Mode
1
Screen 2: Transmitter ID configuration
If you have a cabled station, or if you have a wireless station and are using the
default transmitter ID setting, press DONE to move to the next screen.
Note: Typically, you can use the default transmitter ID setting of 1 unless you are installing
one of the optional transmitter stations. However, if you are having trouble receiving
your station, there may be another ISS with ID 1 operating nearby. Try changing the
ID of both the console and ISS to another ID number.
3. Press the < and > keys to select the transmitter ID.
When you select a transmitter ID, the ID number is displayed on the screen as well
as the current configuration.
4. Press the + and — keys to toggle console reception of signals from transmitters using
that ID on and off.
5. Press GRAPH to change the type of station assigned to each transmitter. Scroll
through the station types — ISS, TEMP, HUM, TEMP HUM, WIND, RAIN, LEAF,
SOIL, and LEAF/SOIL — until the correct type appears.
6. Press DONE to move to the next screen.
Note: This screen contains functionality for enabling repeaters. If the word “Repeater” dis-
plays in the right corner of the screen and you are not using repeaters as part of your
network, see “Clearing Repeater ID” on page 52. If you are using repeaters as part of
your network see “Wireless Repeater Configuration” (Appendix C) on page 51 for
configuring repeaters on the console.
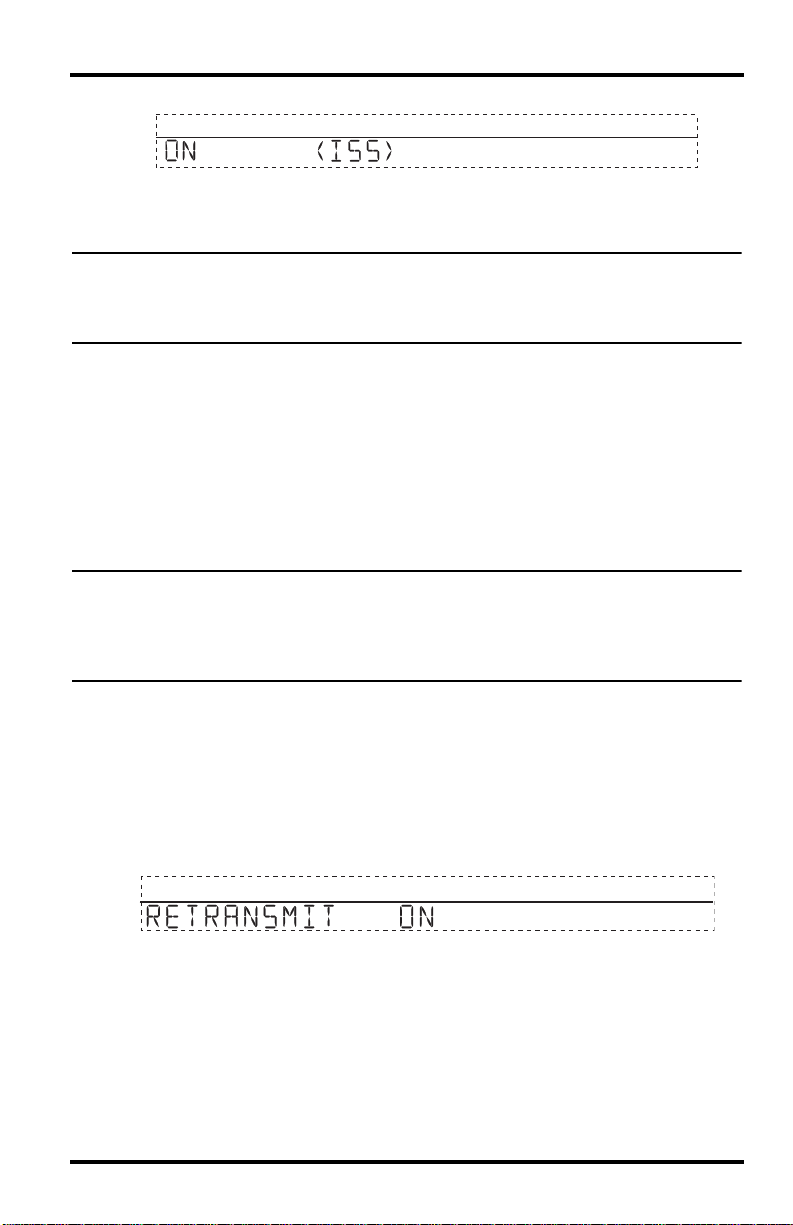
Screen 3: Retransmit — Wireless Only
If you have a cabled station, press DONE and go to “Screen 4: Time & Date” on
page 12.
The console can retransmit the data it receives from the ISS to other Vantage Pro2 or
Vantage Vue consoles using the retransmit feature. By toggling the feature on, the console becomes another transmitter that requires its own unique ID to transmit the data
received from the ISS.
2
Screen 3: Retransmit
1. Press the + or — keys to turn the retransmit function on and off. The first available
transmitter ID not used by the ISS or any optional sensor is automatically assigned.
Data from the ISS is the only data that can be retransmitted by the console.
When retransmit has already been enabled, pressing the < and > keys changes the
Transmitter ID used for retransmit.
2. Use the > key to scroll through the list of available transmitter IDs and select the ID
for your console.
3. Press DONE to move to the next screen.
11
Setup Mode
Note: Make a note of the ID selected for retransmit. The console that receives the data
from the console you have selected to retransmit should be configured to receive the
transmitter ID you selected. See “Screen 2: Configuring Transmitter IDs — Wireless
Only” on page 10 for more information.
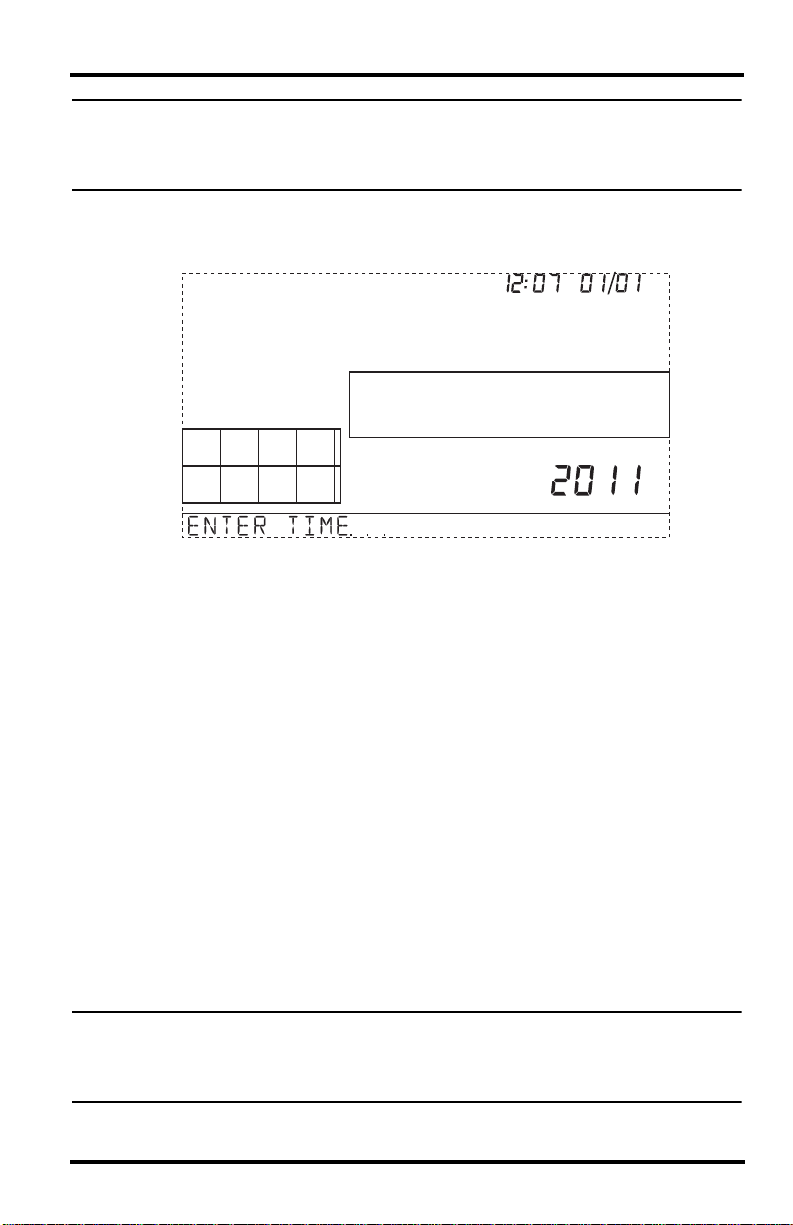
Screen 4: Time & Date
The first time you power-up the console, enter the correct date and local time.
am
Screen 4: Time & Date
To change the time and date:
1. Press the < and > keys to select the hour, minute, month, day or year. The selected
time or date setting blinks on and off.
2. To change a setting, press the + and — keys to adjust the value up or down.
To choose a 12-hour (default in US models) or 24-hour clock (default in EU and UK
models), first select either the hour or minute setting, then press 2ND and immediately press UNITS. This toggles the clock setting between the two clock types.
To choose between a MM/DD (default in US models) or DD.MM (default in EU and
UK models) display for the date, first select either the day or month setting, then
press 2ND and immediately press UNITS. This switches the console from one date
display to the other.
3. Press DONE to move to the next screen.
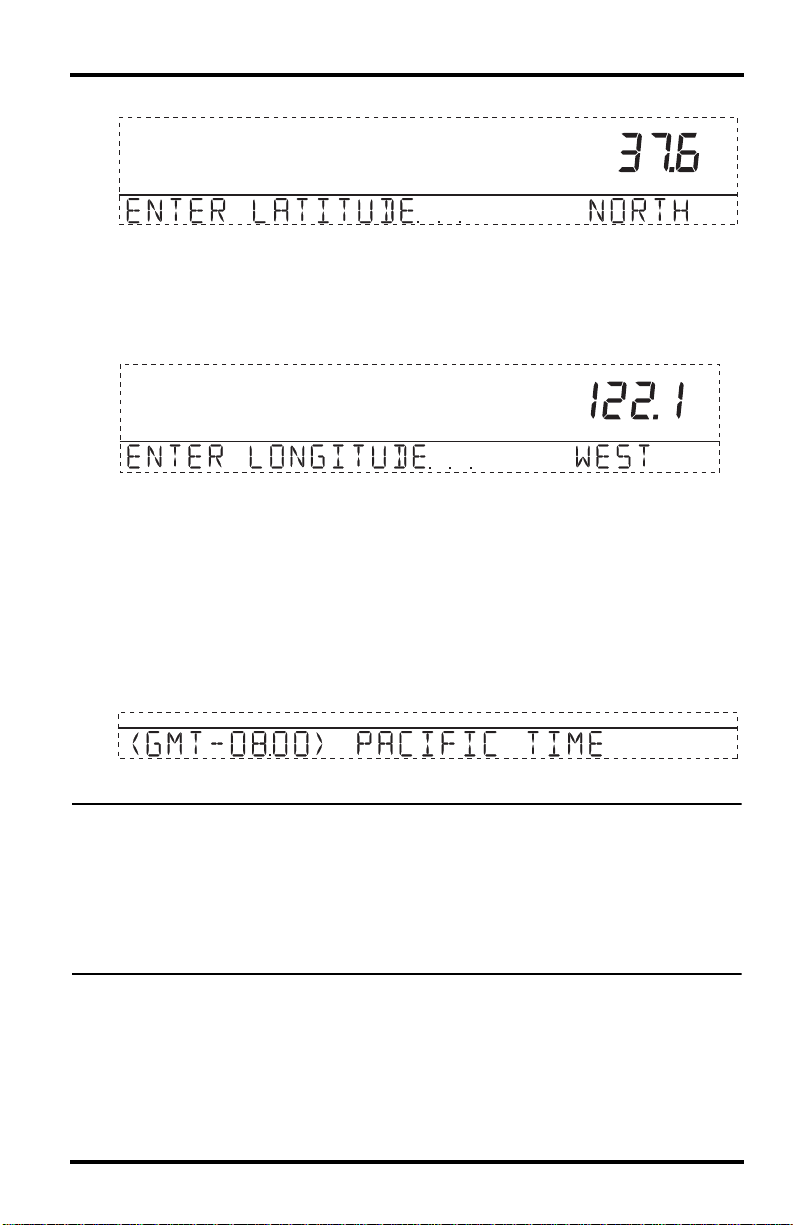
Screen 5 and Screen 6: Latitude and Longitude
The console uses latitude and longitude to determine your location, allowing it to adjust
the forecast and calculate the times for sunset and sunrise.
• Latitude measures distance north or south of the equator.
• Longitude measures distance east or west of the Prime Meridian, an imaginary line
running north and south through Greenwich, England.
Note: You can find your latitude and longitude by searching the internet (for example:
googlemaps.com, earth.google.com or earthtools.org). Many atlases and maps
include latitude and longitude lines. You can also talk to the reference department of
your local library, call your local airport, or search on the Internet.
12
Setup Mode
The more accurate you are, the better; however, a reasonable estimate will work, too.
Screen 5: Latitude
1. Press the < and > keys to move between fields.
2. Press the + and — keys to change the settings up or down.
3. To select between SOUTH or NORTH, press 2ND and then UNITS.
4. Press DONE to move to the Longitude screen.
Screen 6: Longitude
1. Press the < and > keys to move between fields.
2. Press the + and — keys to change the settings up or down.
3. To select the East or West Hemisphere, press 2ND, then UNITS.
4. Press DONE to move to the next screen.
Screen 7: Time Zone
The console is pre-programmed with a combination of US time zones and the names of
major cities representing time zones around the world. You can also configure your
time zone using the Universal Time Coordinate (UTC) offset.
Screen 7: Time Zone
Note: UTC offset measures the difference between the time in any time zone and a stan-
dard time, set by convention as the time at the Royal Observatory in Greenwich,
England. Hayward, California, the home of Davis Instruments, observes Pacific Standard Time. The UTC offset for Pacific Standard Time is -8:00, or eight hours behind
Universal Time (UTC). When it’s 7:00 pm (1900 hours) UTC, it’s 19 — 8 = 1100 hours,
or 11:00 am in Hayward in winter. When daylight saving time is observed, an hour is
added to the offset time automatically. Use this function in correlation with Screen 8,
Daylight Saving Settings.
1. Press the + and — keys to cycle through time zones.
2. If your time zone is not shown, press 2ND then press the + and — keys to set your
UTC offset.
3. Press DONE to select the time zone or UTC offset shown on the screen and move to
the next screen.
13
Setup Mode
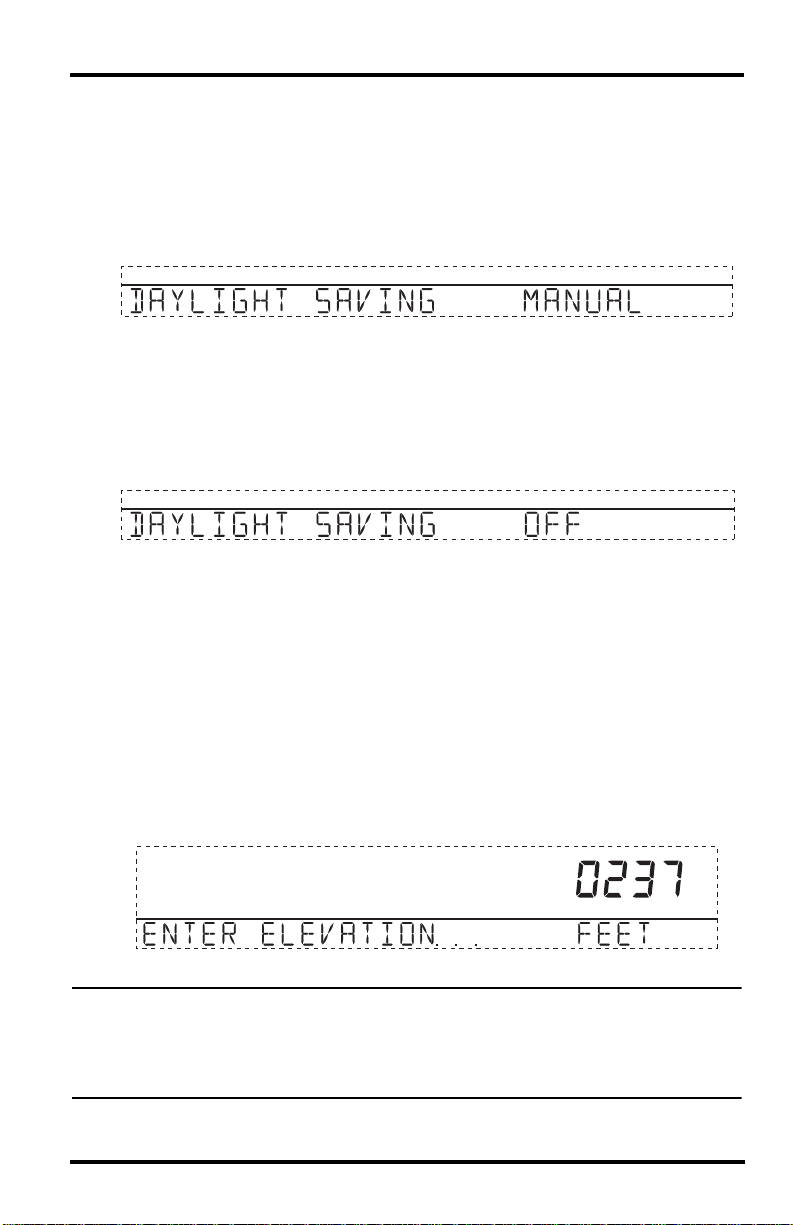
Screen 8: Daylight Saving Settings
In most of North America (except Saskatchewan, Arizona, Hawaii, and the Mexican
State of Sonora); and Europe use the AUTO daylight saving setting. The console is preprogrammed to use the correct starting and stopping dates for daylight saving time in
these areas, based on the time zone setting in screen 7.
Stations located outside North America and Europe, or in areas that do not observe daylight saving time should use the MANUAL setting.
Screen 8: Daylight Saving Settings
1. Press the + and — keys to choose Auto or Manual.
2. Press DONE to move to the next screen.
Screen 9: Daylight Saving Status
Use this screen to either verify the correct automatic daylight saving status or to set
daylight saving manually.
Screen 9: Daylight Saving Status
1. If Daylight Saving setting is MANUAL, you will have to set the time correctly when
it changes. However, to maintain accurate calculations, you also need to use the +
and — keys to turn daylight saving time on or off on the appropriate days of the year.
If you have an AUTO daylight saving setting, the console displays the appropriate
setting based on the current time and date.
2. Press DONE to move to the next screen.
Screen 10: Elevation
Meteorologists standardize barometric pressure data to sea level so that surface readings are comparable, whether they’re taken on a mountainside or by the ocean. To
make this same standardization and ensure consistent readings, enter your elevation in
this screen.
Screen 10: Elevation
Note: If you do not know your elevation, there are several ways to find out. Many atlases
and almanacs include elevation for cities and towns. You can also check with the reference department of your local library, or refer to internet resources. (See “Screen 5
and Screen 6: Latitude and Longitude” for a list of web sites.) The more accurate you
are, the better; but a reasonable estimate works too.
14

Setup Mode
1. Press the < and > keys to move from one numeral to another.
2. Press the + and — keys to adjust a numeral up or down.
3. To switch between feet and meters, press 2ND then press UNITS.
4. If you are below sea level, like in Death Valley or the Salton Sea, first enter the elevation as a positive number. Then, select the “0” immediately to the left of the leftmost non-zero digit (the second zero from the left in 0026, for example, or the first
zero from the left in 0207) and press the + and — keys to switch from a positive to
negative elevation.
Note: You can only set the elevation to negative after you have entered a non-zero digit
and when the zero in the position immediately to the left of the left-most non-zero
digit has been selected.
5. Press DONE to move to the next screen.
Screen 11: Wind Cup Size
Vantage Pro2 stations come standard with large wind cups. Switch this setting to
SMALL CUP if you have separately purchased and installed small wind cups. Switch
to OTHER if you are receiving from a Vantage Vue ISS or are using a third-party anemometer.
Note: Large wind cups are more sensitive to low wind speeds and are the best choice for
most users.
Screen 11: Wind Cup Size
1. Press the + and — keys to switch between the LARGE CUP, SMALL CUP, and
OTHER wind cup settings.
2. Press DONE to move to the next screen.
15

Setup Mode
Screen 12: Rain Collector
The tipping bucket in the Vantage Pro2 rain collector has been calibrated at the factory
to measure 0.01»of rain with each tip for US models, or 0.2 mm of rain with each tip for
UK and EU models. The typical user will not need to change this screen. However,
some US users may want to install a metric adapter on their ISS so that it takes 0.2 mm
readings for every tip of the bucket. If a metric adapter has been installed on your ISS,
you should also calibrate your console for metric measurements using this screen.
Screen 12: Rain Collector Settings
Note: See the Integrated Sensor Suite Installation Manual for instructions on installing the
metric rain adapter. The 0.1mm setting does not provide correct rain measurements
with either the standard measurement or the metric adapter installed in the rain
bucket and should not be used.
To calibrate your console for 0.2 mm measurements:
1. Press the + and — keys to display the 0.2 mm setting.
2. Press DONE to use the selected setting and move to the next screen.
If you calibrate your console for metric rain data in screen 12 of the Setup Mode, you
will also need to set up your Current Weather Mode to display the metric readings. To
display metric rain readings in the Current Weather Mode, once you have completed or
exited the Setup Mode:
To Display Rain in Metric Units on the Console
1. Press RAINYR to display the current rain rate.
RAIN
Selecting Metric units for one rain variable also sets all the other rain
variables to Metric units.
2. Press and release 2ND and press UNITS once.
The units used to display rain data toggle between inches and
UNITS
ND
2
GRAPH
millimeters each time you repeat this key sequence.
To Display Rain in Metric Units in WeatherLink
Refer to the WeatherLink Online Help for instructions to set the rain collector to 0.2
mm and to select millimeters as the unit for rain.
Screen 13: Rain Season
Because rainy seasons begin and end at different times in different parts of the world,
you must specify the month you wish your yearly rain data to begin. January 1
default. The date the rain season begins affects yearly rain rate highs and lows.
st
is the
YR
Screen 13: Rain Season
1. Press the + and — keys to select the month for the start of the rainy season.
2. Press DONE to move to the next screen.
16

Setup Mode
Note: This setting determines when the yearly rain total is reset to zero. Davis Instruments
recommends a January rain season setting (the default), unless you reside in the
west coast of the United States, the Mediterranean coast, experience dry winters in
the Southern Hemisphere. If so, change the rain season setting to July 1st. If you are
performing hydrology studies in any of these climates in the Northern Hemisphere,
change the rain season setting to October 1st.
Screen 14: Serial Baud Rate
The Baud Rate screen displays only if the console detects that a WeatherLink data logger installed on the console.
The console uses a serial or USB port to communicate with a computer. If you are connecting the console directly to your computer via USB or Ethernet, leave the setting at
19200, the highest rate for the port. If you’re using a modem, use the highest setting
your modem can handle. The console must be equipped with a WeatherLink data logger to communicate with a computer or modem.
Screen 14: Baud Rate
Note: The baud rate setting on your console must match the baud rate of the software you
are using. If you are using WeatherLink for Vantage Pro2, refer to WeatherLink help
for instructions on setting the serial port baud rate on your computer.
1. Press the + and — keys to select the baud rate.
Your Vantage Pro2 console supports baud rates of 1200, 2400, 4800, 9600, 14400,
and 19200.
2. You have completed the console setup. To exit Setup Mode, press and hold DONE
until the current weather screen appears.
Clear All Command
After you have completed the above setup procedures and have exited the Setup Mode,
please use the Clear All command before putting your weather station into service.
The Clear All command clears all stored high and low weather data including monthly
and yearly highs and lows and clears the alarm settings. The command is recommended
to properly clear the console of any erroneous data before first putting the station into
use.
1. Press WIND on the console.
2. Press 2ND, then press and hold CLEAR for at least six seconds.
3. Release CLEAR when you see “CLEARING NOW” displayed at the bottom of the
console’s screen.
17

Current Weather Mode
Current Weather Mode
In the Current Weather Mode you can display the current data readings from your station, select units of measure, and calibrate, set, or clear weather variables. You can see
up to ten weather variables on the screen at the same time, as well as the time and date,
the moon and forecast icons, a forecast or special message from your station, and a
graph of the currently selected variable. A few variables are always visible on the console screen while most variables share their location with one or more variables. You
can select any variable not currently on the screen to display it.
Selecting Weather Variables
Select a weather variable to display its data on the screen if it isn’t already visible or to
graph the data available for that variable.
Weather variables are selected via the console command keys:
• If the variable is printed on a key, just press the key to select the variable.
• If the variable is printed on the console housing, first press and release
2ND, then quickly press the key below the variable to select it.
Note: After pressing 2ND, the 2ND icon displays on the screen for three seconds. Com-
mand key secondary functions are enabled during this time. The keys return to normal operation after the icon disappears.
• Select a variable and press GRAPH to graph the variable in the Current
Weather Mode screen. The console places a graph icon on the screen next
to the selected variable or value you want to view to indicate the currently
selected variable.
• You can also select any variable currently displayed on the LCD
screen using the navigation keys. Push up (+) to move up the screen.
Press down (-) to move down the screen. Push left (<) to move left and
push right (>) to move right.
+
<
—
ND
2
>
Selecting Units of Measure
Most weather variables may be displayed in at least two different measurement units,
including imperial (US) and metric systems, although some variables feature more possibilities. Barometric pressure, for example, may be displayed in millibars, millimeters,
inches, or hectoPascals. Note that you can set each variable’s units independently, and
at any time, as you like.
To change units:
1. Select the weather variable. See “Selecting Weather Variables” on page 18.
2. Press and release 2ND then press UNITS. The selected variable’s units change. Repeat steps 1 and 2 until the desired units
appear.
For example, to change the barometric pressure units, first select barometric pressure by pressing BAR. Next, press and release 2ND, then press UNITS. Repeating
ND
2
UNITS
GRAPH
18

Selecting Units of Measure
these steps cycles through the units available for barometric pressure: millibars, millimeters, inches, and hectoPascals.
BAROMETER
BAROMETER
BAROMETER
mm
mb
in
Displaying Units: Barometric Pressure Units: millibars (mb), millimeters (mm) and
F
F
in
STATION NO.1
HUM OUT
HUM IN
TEMP IN
pm
BAROMETER
HEAT INDEX
RAIN YEAR
F
hPa
F
in
WIND
W
TEMP OUT
N
MPH
NE
WIND
NW
E
W
MPH
Last 24 hrshrEvery 1
SESW
NW
S
Vertical Scale: X10
F
N
NE
TEMP OUT
E
TEMP IN
SESW
S
DAILY RAIN
Wind Direction, Outside and Inside Temperature
Wind Speed and Direction
Press WIND to select wind speed.
3. Wind speed may be displayed in miles per hour (m.p.h.), kilometers per
hour (km/h), meters per second (m/s), and knots (knots). The 10 minute
average wind speed will be displayed in the ticker.
A solid arrow within the compass rose indicates the current wind direction. Arrow
caps indicate up to six different 10-minute dominant wind directions to provide a
history of the dominant wind directions for the past hour.
4. Press WIND a second time to display the wind direction
in degrees instead of the wind speed. When displayed in
degrees, Due North displays as 360
firmware dated May 2005 or later. Previous releases
marked Due North at 0
º
.
º
for consoles with
Each additional WIND key press toggles the display
between wind speed and wind direction in degrees.
315˚ NW
270˚ W
225˚ SW
360˚ N
˚
˚
˚
˚
˚
180˚ S
WIND
45˚ NE
˚
90˚ E
˚
˚
135˚ SE
Note: If your anemometer arm is not pointing true north, you should recalibrate the wind
direction reading on your console. See “Calibrate Wind Direction Reading” on
page 25 for more information.
Outside and Inside Temperature
1. Press TEMP to select outside temperature.
19

Selecting Units of Measure
Temperature may be displayed in degrees Fahrenheit (ºF) or Celsius
(ºC). Temperatures can also be displayed in degrees or in tenths of a
TEMP
degree.
2. Press TEMP again to select inside temperature.
Each consecutive press of TEMP displays temperature readings for any optional
temperature, temperature/humidity, soil temperature, soil moisture stations also connected to your console. The order of the optional sensors readings display depends
on your station configuration. Temperatures for temperature stations display, with
soil temperature and moisture stations displaying consecutively.
Humidity
HUM IN
WIND
N
NE
NW
W
MPH
SW
Last 24 hrshrEvery 1
Vertical Scale: X10
TEMP OUT
E
TEMP IN
SE
S
DAILY RAIN
Humidity, Pressure, Dew Point & Wind
F
F
in
STATION NO.1
HUM OUT
HUM IN
HUM OUT
pm
BAROMETER
HEAT INDEX
RAIN YEAR
BAROMETER
hPa
F
DEW POINT
F
CHILL
F
DEW
HUM
hPa
in
Press HUM to select outside humidity. Pressing HUM a second time selects
inside humidity. Humidity is displayed in percent relative humidity. Each consecutive
press of HUM displays humidity readings for any optional humidity, leaf wetness, and
leaf temperature stations also connected to your console. The order of the optional sensors readings display depends on your station configuration. Humidity readings for
humidity stations display, with leaf wetness and leaf temperature readings displaying
consecutively.
Wind Chill
Press 2ND then press CHILL to select Wind Chill. Wind Chill is
displayed in either Fahrenheit (ºF) or Celsius (ºC) in whole
degrees.
The console uses the ten-minute average wind speed to calculate wind chill.
CHILL
ND
2
WIND
Dew Point
Press 2ND then press DEW to select Dew Point. Dew Point is displayed in either Fahrenheit (ºF) or Celsius (ºC) in whole degrees.
Barometric Pressure
Press BAR to select barometric pressure. Barometric pressure may be displayed in
inches (in), millimeters (mm), millibars (mb) or hectoPascals (hPa).
DEW
ND
2
HUM
BAR
20

Selecting Units of Measure
Pressure Trend
The pressure trend arrow indicates the current barometric trend, measured over
the last three hours. The pressure trend is updated every 15 minutes. The pressure trend requires three hours of data in order to be calculated so it won’t display right away on a new station. The pressure trend is indicated on the console screen,
as long as the required data is available.
WIND
N
NE
NW
W
Last 24 hrshrEvery 1
Vertical Scale: X10
MPH
SW
S
UV
inde
index
E
SE
UV, Heat, and THSW Index
TEMP OUT HUM OUT
F
TEMP IN
UV
F
index
DAILY RAIN
in
STATION NO.1
THSW INDEX
pm
BAROMETER
THSW INDEX
RAIN YEAR
hPa
F
in
F
F
HEAT INDEX
UV (Ultraviolet Radiation)
Press 2ND and UV to display the current UV index. The current UV
UV
ND
2
RAIN
index is the amount of ultraviolet radiation the sensor is currently
reading.
Press 2ND and UV again to display the accumulated UV index for the day. The accumulated UV index is the total ultraviolet radiation that the sensor has read throughout
the day. The accumulated UV index for the day is reset to zero every night.
Note: Requires a UV sensor. See “Optional Sensors & Transmitting Stations” on page 2.
Heat Index
Press 2ND then press HEAT to display the Heat Index.
HEAT
ND
2
TEMP
THSW Index
After you have selected the Heat Index, press 2ND then press HEAT again to select the
Temperature Humidity Sun Wind (THSW) Index. The THSW Index is only available
on stations equipped with a solar radiation sensor.
The Heat Index and the THSW Index display in the same place on the screen and are
displayed in degrees Fahrenheit (ºF) or Celsius (ºC).
YR
21

Selecting Units of Measure
RAIN STORM
WIND
N
NE
NW
W
SW
Last 24 hrshrEvery 1
Vertical Scale: X10
TEMP OUT
E
MPH
TEMP IN
SE
S
DAILY RAIN
DAILY RAIN
in
HUM OUT
F
HUM IN
F
in
STATION NO.1
in
RAIN YEAR
pm
BAROMETER
hPa
F
HEAT INDEX
RAIN YEAR
in
RAIN RATE
in
RAIN MO
in
in/hr
Daily Rain, Rain Storm, Rain Year, Rain Month, & Rain Rate
Rain Rate
Press RAINYR to display the current rain rate. Rain Rate may be displayed
as either inches per hour (in/hr.) or millimeters per hour (mm/hr.). Rain Rate
will show zero and the umbrella icon does not appear until two tips of the
rain bucket within a 15–minute period.
UV
RAIN
YR
Month–to–date precipitation
Press RAINYR again to select the month–to–date precipitation record. Monthly rain
displays the precipitation accumulated since the calendar month began. Month–to–date
precipitation is displayed in inches or millimeters (mm).
Year–to–date precipitation
Press RAINYR a third time to display the year–to–date precipitation record. Yearly rain
displays the precipitation accumulated since the 1st of the month you’ve chosen as the
beginning of your rain season in Setup Mode (See “Screen 13: Rain Season” on
page 16). Year–to–date precipitation is displayed in inches (in) or millimeters (mm).
Daily Rain
Press RAINDAY to display the rain accumulated since 12 midnight. Any
rain accumulated in the last 24 hours displays in the ticker at the bottom of
the screen.
RAIN
DAY
Rain Storm
Rain Storm displays the rain total of the last rain event. It takes two tips of the rain
bucket to begin a storm event and 24 hours without rain to end a storm event.
Press RAINDAY to toggle between the daily rain total and the Rain Storm total. Rain
accumulation may be displayed as either millimeters (mm) or inches (in).
22

Selecting Units of Measure
WIND
N
NE
NW
W
MPH
SE
SW
S
Last 24 hrshrEvery 1
Vertical Scale: X10
ET
GRAPH
YEAR
TEMP OUT
TEMP IN
DAILY RAIN
F
F
mm
E
HUM OUT
HUM IN
in
STATION NO.1
pm
BAROMETER
HEAT INDEX
RAIN YEAR
ET
MO
SUN
2
W/m
hPa
F
ET
YEAR
in
mm
mm
Solar Radiation, Current ET, ET Month & ET Year
Solar Radiation
Press and release 2ND then press SOLAR to display the current
solar radiation reading. Solar radiation is displayed as Watts per
square meter (W/m
2
).
Current Evapotranspiration (ET)
Press and release 2ND then press ET to display the current evapotranspiration reading.
SOLAR
ND
2
RAIN
ET
ND
2
BAR
Monthly Evapotranspiration (ET)
Press 2ND then press ET, then repeat the key sequence to display Monthly ET.
Yearly Evapotranspiration (ET)
Press 2ND then press ET, then repeat this key sequence two more times to display the
ET reading since January 1st of the current year.
DAY
Note: A solar radiation sensor is required to take readings listed above. See “Optional Sen-
sors & Transmitting Stations” on page 2.
Lamps
Press 2ND then press LAMPS to turn on the backlight for the screen display.
Press 2ND then LAMPS again to turn the backlight off.
Use the backlight when the LCD is not clearly visible. When the console is
battery operated, the backlight remains on as long as keys are pressed or a ticker tape
message is scrolling across the screen. If no keys are pressed, the backlight automatically turns off about fifteen seconds after it is turned on. If any key is pressed while it is
turned on, it will stay illuminated for 60 seconds from the last key press. When battery
power is low, the backlight does not light.
Note: When the console receives power from the AC adapter, the backlight remains on
until it is toggled off. Leaving the backlight on raises the inside temperature reading
and lowers the inside humidity reading.
23
LAMPS
ND
2

Displaying the Forecast
Displaying the Forecast
Your console generates a weather forecast based on the barometric reading & trend,
wind speed & direction, rainfall, temperature, humidity, latitude & longitude, and time
of year. Included in the forecast is a prediction of the sky condition (sunny, cloudy, etc.)
and changes in precipitation, temperature, wind direction or wind speed.
Press FORECAST to display the forecast. The forecast ticker message at
the bottom of the screen predicts the weather up to 48 hours in advance.
The forecast is updated once an hour, on the hour. Predictions are made for cloud cover,
temperature trends, the likelihood of precipitation, timing, severity and windy conditions.
Forecast Icons
The forecast icons show the predicted weather for the next 12 hours. If rain and/or
snow is possible but not necessarily likely, the partly cloudy icon along with the rain or
snow icon displays. When both the rain and snow icons display together, a chance of
rain, freezing rain, sleet and/or snow is likely.
Mostly Clear Partly Cloudy Mostly Cloudy SnowRain
FORECAST
Displaying Time & Date or Sunrise & Sunset
Your console shows the sunrise and sunset time in the same place on the screen used by
the current time and date. Press 2ND and then press TIME to toggle the screen between
the current time and date or the sunrise and sunset times for the current day.
Note: See “Screen 4: Time & Date” on page 12 to change the console time and date or to
select a 12- or 24-hour clock.
24

Calibrating, Setting, and Clearing Variables
Calibrating, Setting, and Clearing Variables
To fine-tune your station, you can calibrate most of the weather variables. For example,
if your outside temperature seems consistently too high or too low, you can enter an
offset to correct the deviation.
Calibrating Temperature And Humidity
You can calibrate inside & outside temperature, inside & outside humidity, as well as
any extra temperature/humidity sensor readings you have transmitting to your Vantage
Pro2.
1. Select a variable to be calibrated. See “Selecting Weather Variables” on page 18.
2. Press and release 2ND, then press and hold SET.
After a moment, the variable you’ve selected begins to blink.
Keep holding SET until the Calibration Offset message displays in the ticker.
The ticker displays the current calibration offset.
3. Press the+ and — keys to add or subtract from the temperature offset value.
Inside and outside temperature are calibrated in 0.1° F or 0.1° C increments, up to a
maximum offset of +12.7 (°F or °C) and a minimum offset of -12.8 (°F or °C). The
variable will change value and the ticker will show the offset you’ve entered.
4. Press DONE to exit calibration.
Calibrate Wind Direction Reading
If the anemometer arm cannot be mounted pointing to true north, use this procedure to
correct the wind direction console reading.
1. Check the current direction of the wind vane on the anemometer. Compare it to the
wind direction reading on the console.
2. Press WIND as necessary to display the wind direction in degrees.
3. Press and release 2ND, then press and hold SET.
4. The wind direction variable will begin to blink.
5. Continue holding the key until the CAL message appears in the ticker. The ticker
displays the current wind direction calibration value.
6. Press the < and > keys to select digits in the anemometer’s current reading.
7. Press the + and — keys to add/subtract from the anemometer reading.
8. Repeat steps 6 and 7 until you have entered the offset value from Step 1.
9. Press DONE to exit calibration.
Calibrating Barometric Pressure
Before calibrating the barometric pressure, be sure the station is set to the correct elevation. See “Screen 10: Elevation” on page 14 for more information.
1. Press BAR to select barometric pressure.
2. Press and release 2ND, then press and hold SET.
The pressure variable blinks.
3. Continue holding the key until the ticker reads “set barometer . . . ”.
4. Press the < and > keys to select digits in the variable.
5. Press + and — keys to add to or subtract from the digit’s value.
2
SET
ND
ALARM
25

Calibrating, Setting, and Clearing Variables
6. Press DONE to exit calibration.
Setting Weather Variables
You can set values for the following weather variables:
• Daily Rain—Sets the daily rain total. Monthly and yearly rain totals are updated.
• Monthly Rain—Sets the current months total rain. Does not affect yearly rain total.
• Yearly Rain—Sets the current year’s rain total.
• Daily ET (Evapotranspiration)—Sets the daily ET total. Monthly and yearly ET
totals are updated.
• Monthly ET—Sets the current month’s ET. Does not affect yearly total.
• Yearly ET—Sets the current year’s total ET.
To set a weather variable’s value:
1. Select the variable you wish to change.
2. Press and release 2ND, then press and hold SET. The variable blinks.
3. Keep holding SET until all digits are lit and only one digit is blinking.
4. Press the < or > keys to select digits in the value.
5. Press the + and — keys to add to or subtract from the selected digit.
6. When you are finished, press DONE to exit.
Clearing Weather Variables
The following weather variables can be cleared:
• Barometer—Clears any pressure offset used to calibrate the station, and the elevation entry.
• Wind—Clears the wind direction calibration.
• Daily rain—Clearing the daily rain value is reflected in the daily rain total, the last
15 minutes of rain, the last three hours of rain sent to the forecast algorithm, the
umbrella icon, and the monthly and yearly rain totals. Clear the daily rain total if the
station accidentally recorded rain when the ISS was installed.
• Monthly rain—Clears the monthly rain total. Does not affect the yearly rain total.
• Yearly rain—Clears the yearly rain total.
• Daily ET—Clears daily ET and subtracts the old daily ET total from the monthly
and yearly ET totals.
• Monthly ET—Clears the current monthly ET total. Does not affect the yearly ET
total.
• Yearly ET—Clears the current yearly ET total.
To clear a single weather variable:
1. Select the weather variable.
See “Selecting Weather Variables” on page 18.
2. Press and release 2ND, then press and hold CLEAR.
The variable you’ve chosen blinks. Keep holding the key until the value changes to
zero or, in the case of the barometer, the raw barometer value. Clearing the barometer value also clears the elevation setting.
Clear All Command
This command clears all stored high and low weather data including monthly and
yearly highs and lows and clears alarm settings all at once.
1. Press WIND on the console.
26

Highs and Lows Mode
2. Press 2ND then press and hold CLEAR for at least six seconds.
3. Release CLEAR when “CLEARING NOW” displays at the bottom of the console’s
screen.
Highs and Lows Mode
The Vantage Pro2 records highs and lows for many weather conditions over three different periods: days, months, and years. Except for Yearly Rainfall, all high and low
registers are cleared automatically at the end of each period.
For example, daily highs are cleared at midnight, monthly highs are cleared at month–
end midnight, yearly highs are cleared at year–end midnight. You may enter the month
that you would like the Yearly Rainfall accumulation to clear. The Yearly Rainfall
clears on the first day of the month you chosen. The Yearly High Rain rate clears using
the same setting.
The following table lists the high and low modes for all the weather variables:
Weather Variable High Low
Outside Temperature Yes Yes Yes Yes Yes
Inside Temperature Yes Yes Yes Yes Yes*
Outside Humidity Yes Yes Yes Yes Yes*
Inside Humidity Yes Yes Yes Yes Yes*
Barometer Yes Yes Yes Yes Yes*
Heat Index Yes Yes Yes Yes*
Temp/Hum/Wind/Sun
(THSW) Index
Wind Chill Yes Yes Yes Yes*
Wind Speed Yes Yes Yes Yes Includes direction
Rainfall Rate Yes Yes Yes Yes
Daily Rain Total Total Total
UV Index Yes Yes Yes** Yes* requires UV sensor
Solar Radiation Yes Yes Yes** Yes* requires solar radiation sensor
Dew Point Yes Yes Yes Yes Yes*
Evapotranspiration Total Total Total requires solar radiation sensor
Soil Moisture Yes Yes Yes Yes** Yes* requires soil moisture sensor
Leaf Wetness Yes Yes Yes No Yes* requires leaf wetness sensor
* Only stores the yearly high for the current year.
** Only stores monthly high for the current month.
Yes Yes Yes Yes* requires solar radiation sensor
Viewing Highs and Lows
1. Press HI/LOW to enter the Highs and Lows mode.
The DAY and HIGHS icons light up and the station displays the highs for all visible
fields.
2. Press the + and — keys to scroll between Day Highs, Day Lows, Month Highs, Month
Lows, Year Highs and Year Lows.
Day,
Time &
Month Year Additional Information
Date
Weather Data Highs and Lows
27

The HIGH or LOW icon, as well the DAY, MONTH or YEAR icon lights to display
which High/Low screen you’ve selected.
3. Press the < and > keys to scroll back and forth through the last 24 values.
Pressing the < key displays the previous day’s highs. Each time you press the < key,
the date moves back another day. The 24 dots in the graph field also represent each
of the last 24 days, months, or years; the right-most dot is the present. As you move
backward and forward the flashing dot changes to show what value you’re looking
at.
4. Use the console keys to select a different weather variable.
The console’s time displays time of the selected variable’s high or low.
5. Press DONE to exit the Highs and Lows mode. The console screen switches to the
Current Weather mode.
Alarm Mode
The Vantage Pro2 features more than 30 alarms that can be programmed to sound
whenever a reading exceeds or drops below a set value. With the exception of barometric pressure and time, all alarms sound when a reading reaches the alarm threshold. For
example, if the high outside temperature alarm is set at 65º F, the alarm sounds when
the temperature rises to 65.0º F.
When an alarm condition exists, the audible alarm sounds, the alarm icon blinks repeatedly, and an alarm description appears in the ticker at the bottom of the screen. The
alarm sounds for a maximum of two minutes if the console is battery-powered, but the
icon continues to blink and the message stays in the ticker until you clear the alarm or
the condition clears. If you’re using the AC adapter, the alarm will continue sounding
as long as the condition exists.
The alarm will sound again for each new alarm. If more than one alarm is active, the
description for each active alarm cycles onto the screen every four seconds. A “+” symbol appears at the end of the alarm text if more than one alarm is tripped.
Low alarms work the same way. For example, if the wind chill threshold is set for 30ºF,
the alarm condition begins when the wind chill drops to 30º and will continue until the
wind chill rises above 30º.
Four Special Alarms
ET (Evapotranspiration)
ET is updated only once an hour, on the hour. If during a given hour the ET Value
exceeds the alarm threshold, the ET alarm sounds at the end of that hour. This is true
for daily, monthly, and yearly ET alarms. You must have the optional Solar Radiation
Sensor to use this alarm. See “Evapotranspiration (ET)” on page 46. for a description of
this variable.
Barometric Pressure
The Vantage Pro2 allows you to set two barometric pressure alarms: a “rise” alarm and
a “fall” alarm. You may select any rate of change per three hours between 0.00 and 0.25
inches (6.35 mm) Hg, (8.5 mb, hPa); the alarm will sound if the rate of change (in
either direction) exceeds the threshold you set. This alarm is updated every 15 minutes.
Time
The time alarm is a standard “alarm clock” alarm. It sounds for one minute at the set
time. Make sure you choose AM or PM, if you’re in 12-hour mode.
Alarm Mode
28

Alarm Mode
UV Dose
The UV dose alarm sounds when the accumulated UV dose has exceeded the dose you
set. The UV dose alarm does not arm unless the initial UV dose for the day has been
reset. Once the UV dose alarm value is set, clear the accumulated UV dose. See “Clearing Weather Variables” on page 26.
Setting Alarms
1. Press ALARM to enter the Alarm Mode to view or set the high alarm thresholds.
The screen displays the current high alarm thresholds. The ALARM and HIGHS
icons also appear.
2. Press the < and > keys to select one of the variables displayed on the screen or use
the console keys to select any weather variable. Also, press HI/LOW to display the
toggle between the high and low alarm threshold settings.
3. Press 2ND then press ALARM to activate the currently selected weather variable.
4. Press the < and > keys to select digits in the threshold value.
5. Press the + and — keys to change the digit’s value up and down.
6. Press DONE to finish changing the alarm setting.
7. Repeat steps 3 through 6 to change additional alarm settings.
8. Press DONE to exit Alarm Mode.
29

Alarm Mode
Vantage Pro2 Station AlarmsVantage Pro2 Station Alarms
Variable Alarms
Barometric Pressure Trend
Evapotranspiration ET Alarm — uses total ET for the day
Humidity, Inside High and Low
Humidity, Outside High and Low
Dew Point High and Low
Leaf Wetness High and Low
Rain
Storm Storm Alarm — uses current storm rainfall total
Rain Rate High
Soil Moisture High and Low
Solar Radiation High
Inside Temperature High and Low
Outside Temperature High and Low
Extra Temperature High and Low
Heat Index Temperature High
THSW Index Temperature High
Wind Chill Temperature Low
UV Radiation Index High
UV Radiation MED High — uses the current total if variable has been reset
Wind Speed High
Time & Date Yes — the alarm sounds for 1 minute.
Storm Warning — uses trend value falling rate
Storm Clearing — uses trend value rising rate
Flash Flood Alarm — uses current 15 minute rainfall total
24 Hour Rain Alarm — uses current 24 hour rainfall total
Setting the Time Alarm
1. Press ALARM to enter alarm mode.
The ALARM and HIGHS icons appear.
2. Press 2ND, then press TIME, then press 2ND again, and then press ALARM.
The time field begins blinking.
3. Press the < and > keys to select hours, minutes, or AM/PM.
4. Press + and — keys to change the digit’s value up and down.
5. Press DONE to exit Alarm Mode.
30

Graph Mode
Clearing Alarm Settings
1. Press ALARM to enter alarm mode.
The ALARM and HIGHS icons appear.
2. Select the alarm setting you wish to clear.
3. Press 2ND, then press and hold CLEAR until the setting changes to all dashes.
You have cleared the alarm setting.
4. Press DONE to exit Alarm Mode.
Note: To clear all alarms, enter Alarm mode (press and release the ALARM key), then
press and hold the ALARM key until all the fields become dashed.
Silencing Alarms
1. Press DONE to silence an alarm when it sounds.
Graph Mode
The Vantage Pro2 console includes a powerful Graph Mode that allows you to view
over 100 graphs of different kinds right on the screen, all without connecting to a personal computer.
Viewing Graphs
Although the graphs available may vary for each weather variable, you display the
graphs in the same way.
1. Select a variable to graph.
Only the date, graph, graph icon,
and selected variable are visible.
GRAPH
TEMP OUT
F
The rest of the screen is blank.
2. Press GRAPH to enter Graph
Mode.
Last 24 hrshrEvery 1
Values for the each of the last 24
hours are displayed in the graph,
Vertical Scale: 2
each hour represented by a dot.
The dot at right end of the graph is the value for the current hour. You’ll notice that
the dot is blinking.
3. Press the < key and the second dot from the right starts to blink.
The screen displays the new dot’s value. The time display shows what hour of the
last 24 is being viewed.
4. Press the < and > keys to view the variable’s values for each of the last 24 hours. The
console also displays the maximum and minimum temperatures recorded in the last
24 hours.
5. Press the + and — keys to shift the graph’s time span.
am
31

Graph Mode
If you press the — key the graph
shifts from the last 24 hours to the
last 24 days. Now each dot repre-
GRAPH
TEMP OUT
F
sents the high recorded on the day
shown in the date field. To see the
lows recorded in the last 24 days,
HIGHS
Last 24 days
Every 1
day
press HI/LOW. Press the < and >
keys to move between days.
Vertical Scale: 5
By pressing the — key again, the
graph shifts to show the highs of the
last 24 months. As before, use the < and > keys to move between months. Press HI/
LOW to shift between the highs and lows.
By pressing the — key again, the graph shifts one more time to show the highs of the last
24 years. Press HI/LOW to shift between highs and lows.
The console beeps when you’ve reached the first or last possible value or time span for
the graph. Since the console only graphs data collected by the station, the graphs can
only show data collected since the station was first installed.
View graphs of all other variables the same way.
1. Select the variable you want to view.
2. Press GRAPH.
3. Use the < and > keys to select different variables.
4. Press the + key to shorten the time range.
5. Press the — key to lengthen the time range.
6. Press HI/LOW to shift between highs and lows.
7. Press DONE to exit.
32

Graph Mode
Vantage Pro2 Console Graphs
Weather Variable Available Graphs*
Current
1 Min
10 Min
15 Min
Hourly
Barometric Pressure C C C H, L H, L
Evapotranspiration (ET)** T TTTT
Humidity, Inside C C H, L H, L
Humidity, Outside C C H, L H, L
Dew Point C C H, L H, L
Leaf Wetness*** C C H, L
Rain T TTTTT
Storm****
Rain Rate H H HHHH
Soil Moisture C C H, L
Solar Radiation** A A H
Inside Temperature C C H, L H, L
Outside Temperature C C H, L H, L H, L
Heat Index Temperature C C H H
Temp/Hum/Sun/Wind (THSW) Index** C C H H
Wind Chill Temperature L L L L
UV Radiation Index***** A A H C
UV Radiation MED (Minimal Erythermal
Dose)*****
Wind Speed A A A, H H H H
Direction of High Wind Speed Y Y Y Y
Dominant Wind Direction A A A A
* A = Average, H = Highs, L = Lows, T =Totals, Y = Yes, C = Current reading at the end of each
period
** Requires solar radiation sensor, *****Requires UV sensor
*** Requires Wireless Leaf & Soil Moisture Temperature station
**** Graphs the last 24 storm events and doesn’t follow the same graph conventions as other
variables.
TTT
Daily
Monthly
Yearly
33
Chapter 4
Troubleshooting and Maintenance
Vantage Pro2 Troubleshooting Guide
While your Vantage Pro2 weather station is designed to provide years of trouble-free
operation, occasional problems may arise. If you are having a problem with your station, please consult this troubleshooting guide before calling Davis technical support.
You may be able to quickly solve the problem yourself. Please see “Contacting Davis
Technical Support” on page 53.
Note: Refer to the ISS Installation Manual for additional troubleshooting information.
TABLE 4-1: TROUBLESHOOTING GUIDE
Problem Solution
Display shows only
“RECEIVING FROM…..”
Display is blank
Display shows dashes in
place of weather data
Display
Console is sluggish or does
not work at low temperatures
Display “locks up”
Indicates that console has rebooted. Hold the DONE key to return to Current Weather Mode. (Check time setting if power was
lost.)
Unit is not receiving power. Check the power adapter connections and/or replace batteries.
• ISS not plugged in (cabled station). See ISS manual.
• Sensors not transmitting (wireless station). See ISS (or other transmitter) manual.
• Console not receiving (wireless station) — See “Troubleshooting Reception Problems” on page 35.
• A reading has exceeded the limits indicated in the
specifications table.
• Calibration numbers may be causing readings to exceed
display limits. Check calibration number and adjust if necessary.
The console and display may not work below 32º F (0º C). Use
an External Temperature sensor in low-temperature locations or
install the console indoors.
Reset the console by removing AC and battery power then restoring power. If this occurs frequently in an AC-powered console, plug the AC power-adapter into a surge suppressor.
Inside humidity seems too
high or too low
Humidity
Wind speed reading seems
too high or too low.
Wind speed reads 0 either
all the time or intermittently
Wind Speed
Dew Point reading seems
too high or too low
Dew
Make sure the console is not near a humidifier or de-humidifier.
Check calibration number and adjust if necessary. If inside humidity is low, and inside temperature is too high, see “inside
temp” below. Also make sure the console backlight is not on.
For low readings, remove wind cups and check for friction
sources. Check the anemometer location. Is it sheltered from
the wind? See ISS manual for additional wind speed
troubleshooting information.
The problem may be with the anemometer. Test anemometer
by spinning wind cups. Check reed switch fields on diagnostic
screen (see page 37) and call technical support.
Check calibration numbers for temperature. Dew point depends
on temperature and outside humidity. Make sure they’re working.
34

Vantage Pro2 Troubleshooting Guide
TABLE 4-1: TROUBLESHOOTING GUIDE
Problem Solution
Outside temperature sensor reading seems too high
Inside temperature sensor
reading seems too high
Outside temperature
Temperature
seems too low
Inside temperature sensor
reading seems too low
Wind direction reading is
dashed out
Wind direction always says
north
Wind Direction
Check to see if ISS is near mechanical or radiant heat source.
Check calibration number and adjust if necessary. ISS or temp
sensor may need to be relocated. See ISS or other transmitter
manual.
Move the console out of direct sunlight. Make sure that the console or sensor is not in contact with an exterior wall that heats
up in sunlight or when outside temperature rises. Make sure the
console or sensor is not near a heater or other internal heat
source (lamps, appliances, etc.). Also make sure the console
backlight is not on. Check calibration number and adjust if necessary.
Check calibration number and adjust if necessary. Sprinklers
may be hitting the ISS radiation shield. Relocate. See ISS manual.
Make sure the console or other temperature sensor is not in
contact with an exterior wall that cools down when outside temperature drops. Make sure the console or other temperature
sensor is not near an air conditioning vent. Check calibration
number and adjust if necessary.
• Wireless model — check reception. See Reception Problems below.
• Cabled model — cable may be faulty.
If these steps do not reveal the problem, the anemometer may
be faulty. Call technical support.
Usually a problem in the ISS, either with the transmitter or anemometer cable. See the ISS manual for troubleshooting information.
Wind chill reading seems
too high or too low
Chill
Heat Index reading seems
too high or too low
Heat
No rain readings
Rain
Readings are too high Can be caused by high thin cirrus clouds.
Check calibration numbers for temperature. Wind chill depends
on temperature and wind speed. Make sure they’re working.
Check calibration numbers for temperature. The heat index depends on temperature and outside humidity. Make sure the sensors are working.
Make sure cable-tie is removed from inside the rain collector.
See the ISS manual.
UV/Solar
Incorrect times for sunrise
and sunset
Time
Check your latitude, longitude, time zone, and daylight savings
time settings. Sunrise and sunset times are calculated from the
console using all of these settings.
Troubleshooting Reception Problems
While we have tested the Wireless Vantage Pro2 radio extensively, each site and each
installation presents its own issues and challenges. Obstructions, particularly metallic
ones, often cut down your station’s reception distance. Be sure to test reception
between the console and ISS, in the locations you intend to install them, before permanently mounting your ISS or other transmitter(s).
The console’s reception status displays at the lower right corner of the screen.
35

Console Diagnostic Mode
• An “X” flashes for every data packet received by the console.
• An “R” displays when the console is trying to re-establish a lost connection. The
console tries for 10 minutes to re-establish a connection before going into L
Mode.When no data packets have been received for 10 minutes, the console dashesout any missing sensor readings.
• An “L” displays when the signal is lost (and the console is “asleep.”) The console
stays in this mode for 15 minutes until returned to “R” mode. To force the console
into “R” mode (“wake up” the console), enter and exit Setup Mode.
Check Console Reception
Enter Setup mode by pressing and holding DONE, then pressing the — key at the same
time. Wait a few minutes while the console lists all the stations transmitting within
range (See “Screen 1: Active Transmitters” on page 10 for more information). If the
console does not detect your transmitter, check the following:
• Adjust the console and ISS antennas so that they are in line of sight with each other.
• Reduce the distance between the ISS and the console.
• If the console is directly beneath the ISS, the antennas should be horizontal.
• Try distancing your console from your ISS, at least 10 feet apart.
• Change the Transmitter ID (on both the console and the ISS) to a number other than
1.
Refer to the ISS Installation Manual or other station manual for instructions on how to
check the station for potential transmission problems.
Console Diagnostic Mode
In addition to logging weather data, the console continuously monitors the station’s
radio reception. You may find this information very helpful, especially when you are
choosing locations for your console and ISS.
The Console Diagnostics Mode consists of two screens, the Statistical Diagnostic
Screen and the Reception Diagnostic Screen. The Statistical Diagnostic screen applies
for both cabled and wireless weather stations. The Reception Diagnostic screen applies
only to wireless weather stations and is not accessible to a cabled weather station.
Note: Radio transmission data used by the diagnostic screens clears each day at midnight.
Diagnostic Screen Commands
• Press and hold TEMP, then press HUM to display the Statistical Diagnostic screen.
• Press the > key to display signal statistics for the next installed transmitter ID.
• Press 2ND and then press CHILL to toggle between the Statistical and Reception
Diagnostic screens.
• A degree (
°) sign displays in right corner of value 1 of the Reception Diagnostic
screen (screen 2) to differentiate which screen is currently displayed.
• Press DONE to exit the diagnostic screen.
36

Console Diagnostic Mode
Screen 1: Statistical Diagnostic Screen
The Statistical Diagnostic displays information about how data is being received from
the weather station to the console. The information that is displayed in this screen
includes:
am
Every 1
day
Last 24
days
Vertical Scale: 1 0
Screen 1: Statistical Diagnostics Screen
Note: All values with a * mark the value as being for Davis Instruments Internal use. All values with a ‡
mark values that are the same on both the Statistical and Reception Diagnostic screens.
1. Time of day or number of times the anemometer reed switch was seen closed*.
The reed switch closes once each revolution of the anemometer wind cups. Press
WIND to toggle between these two values.
2. Date or the number of times the anemometer reed switch was seen open
WIND to toggle between these two values.
Note: The time and date displays can be toggled in both statistical and reception diagnostic screens.
STATION NO. 5
*
. Press
3. Number of packets containing CRC errors received. The system runs a CRC check
on data packets. Any data packets that don’t pass this check are considered to contain errors and are discarded. These are considered bad packets.
4. The total number of bad data packets including missed packets and CRC errors.
Missed packets are described as when a data packet is expected, but is not recognized as a data packet by the console.
5. Percentage of good packets received.
6. Total number of good packets received.
7. Number of times the console resynchronized with the transmitter. The console will
attempt to resynchronize with the station after 20 consecutive bad packets.
8. Maximum number of bad packets in a row without resynchronization.
9. Current streak of consecutive bad packets. The counter increments when the con-
sole is synchronized but the packet is bad. This value is reset to zero when a good
packet is received.
37

Console Diagnostic Mode
10. Longest streak of consecutive good packets received.
11. Current streak of consecutive good packets received.
12. Graph of the daily percentage of good data packets received over the last 24 days.
13. Background noise level. This refers to the undesirable signal level the console
hears while it is in the process of acquiring a signal from a station. The range displayed is from 5 to 60. When the noise level is high, try to move the console closer
to the station to get a stronger signal. Small background noise level does not
always guarantee good reception. The signal strength between the station and the
console needs to be stronger than the background noise level in order for the console to receive clearly. If there are reception problems while a small background
noise level is still being displayed, make sure the console is within reasonable
range of the station.
If the console currently has acquired all the station signals it is set to receive, the
background noise level displayed is the last noise level measurement taken before
acquisition finished.
14. Current console battery voltage. Ignore this value if using the AC Adapter only to
power the console.
15. Repeater ID currently communicating with the console. If a repeater or group of
repeaters is used to relay station information to the console, the Repeater ID displayed is the repeater that the console is set to receive. If the console is not listening to repeaters, this section remains blank. Please see Application Note 25
available on the Davis Instruments Support web page for more information on
using repeaters.
Note: The Repeater ID does not display in the ticker banner in firmware versions earlier than May 2005,
or Version 1.6. If you want your console to support repeater communication, upgrade your console to the most recent console firmware version.
16. The console’s reception status. See “Troubleshooting Reception Problems” on
page 35 for information on the status types.
Screen 2: Reception Diagnostic Screen
The Reception Diagnostic screen displays information pertinent to the console’s wireless reception. To view this screen from the Statistical Diagnostic screen, press 2ND
and then press CHILL. The degree sign displaying in the upper left corner next to value
1 verifies that the Reception Diagnostic screen is currently displayed.
38

Console Diagnostic Mode
The information that is displayed in this screen includes:
1
2
3
am
4
°
5
Last 24
days
Vertical Scale: 1 0
1. 8-bit timer value of next reception.
day
Every 1
STATION NO. 5
Screen 2: Reception Diagnostics Screen
*
2. Radio frequency error of the last packet received successfully. In normal opera-
tion, this value is +1, -1, or 0. This value affects the value of #5 on the next page.
3. Percentage of good data packets.
‡
4. Signal strength of the last packet received. The values displayed in this field
should generally be between 20 and 60. If a packet is not received successfully,
the signal strength field is dashed out (—).
5. Current frequency correction factor. Shows the Automatic Frequency Control set-
ting.
6. Frequency index of the next packet to be received.
7. Current number of consecutive bad packets.
8. The number of times that the Phase Lock Loop did not lock.
9. Current streak of consecutive good packets received.
*
‡
*
‡
Console Firmware Versions
In some cases, the problem may be that your console firmware doesn’t support what
you are trying to do. Use this command to determine the firmware revision level in
your console. You can find more information on Vantage Pro2 console firmware versions and changes in the Weather Software Support section of our website. — for information.
Press and hold DONE then press the + key at the same time to display the console firmware version in the ticker at the bottom of the screen.
7
6
8
9
39

Console Maintenance
Console Maintenance
Changing Batteries
Use this procedure to change console batteries without losing any stored weather data
or console configuration settings.
1. Plug in the AC adapter or, if the AC adapter is not present, enter Setup Mode by
pressing DONE and then the — key.
Note: If you cannot plug in the AC Adapter, entering Setup Mode makes sure the station isn’t writing
any data to memory when power is removed and avoids data loss.
2. Remove the battery cover located on the back of the console by pressing down on
the two latches at the top of the cover.
3. Place the console face down on a flat, firm surface.
4. Insert a fingertip between the two exposed batteries then press the middle battery
down toward the notch (toward the “hidden” battery). This will relieve tension on
the first battery and allow you to remove it.
5. Remove the old batteries and install the new batteries.
6. Replace the battery cover and remove the AC power adapter, if used.
7. Check and set date and time if power was lost.
One Year Limited Warranty
For details on our warranty policy, please refer to the Maintenance, Service, and Repair
Information brochure included with your station.
40

Appendix A
Weather Data
Refer to this appendix to learn more about the weather variables that are measured, displayed, and logged by your Vantage Pro2 Station. Some weather variables require
optional sensors. See “Optional Sensors & Transmitting Stations” starting on page 2.
Wind
The anemometer measures wind speed and direction, and is part of the Integrated Sensor Suite (ISS). The console calculates a 10-minute average wind speed and 10-minute
dominant wind direction. The 10-minute average wind speed is displayed in the console ticker whenever wind has been selected on the console. The last six 10-minute
dominant wind directions are included in the compass rose wind display.
Temperature
The ISS houses the outside temperature sensor in a vented and shielded enclosure that
minimizes the solar radiation induced temperature error. The console houses the inside
temperature sensor. Additional temperature sensors are available for wireless stations
and can measure up to eight locations.
Apparent Temperatures
Vantage Pro2 calculates three apparent temperature readings: Wind Chill, Heat Index,
and the Temperature/Humidity/Sun/Wind (THSW) Index. Apparent temperatures use
additional weather data to calculate what a human body perceives the temperature to be
in those conditions.
Wind chill
Wind chill takes into account how the speed of the wind affects our perception of the
air temperature. Our bodies warm the surrounding air molecules by transferring heat
from the skin. If there’s no air movement, this insulating layer of warm air molecules
stays next to the body and offers some protection from cooler air molecules. However,
wind sweeps that warm air surrounding the body away. The faster the wind blows, the
faster heat is carried away and the colder you feel. Wind has a warming effect at higher
temperatures.
Note: Wind chill is not calculated above 92° F (33° C).
Heat Index
The Heat Index uses temperature and the relative humidity to determine how hot the air
actually “feels.” When humidity is low, the apparent temperature will be lower than the
air temperature, since perspiration evaporates rapidly to cool the body. However, when
humidity is high (i.e., the air is more saturated with water vapor) the apparent temperature “feels” higher than the actual air temperature, because perspiration evaporates
more slowly.
41

Note: Heat Index is equal to the air temperature at or below 0° F (-18° C).
Temperature/Humidity/Sun/Wind (THSW) Index
The THSW Index uses humidity and temperature like for the Heat Index, but also
includes the heating effects of sunshine and the cooling effects of wind (like wind chill)
to calculate an apparent temperature of what it “feels” like out in the sun. The THSW
Index requires a solar radiation sensor.
Humidity
Humidity itself simply refers to the amount of water vapor in the air. However, the total
amount of water vapor that the air can contain varies with air temperature and pressure.
Relative humidity takes into account these factors and offers a humidity reading which
reflects the amount of water vapor in the air as a percentage of the amount the air is
capable of holding. Relative humidity, therefore, is not actually a measure of the
amount of water vapor in the air, but a ratio of the air’s water vapor content to its capacity. When we use the term humidity in the manual and on the screen, we mean relative
humidity.
It is important to realize that relative humidity changes with temperature, pressure, and
water vapor content. A parcel of air with a capacity for 10 g of water vapor which contains 4 g of water vapor, the relative humidity would be 40%. Adding 2 g more water
vapor (for a total of 6 g) would change the humidity to 60%. If that same parcel of air is
then warmed so that it has a capacity for 20 g of water vapor, the relative humidity
drops to 30% even though water vapor content does not change.
Relative humidity is an important factor in determining the amount of evaporation from
plants and wet surfaces since warm air with low humidity has a large capacity to absorb
extra water vapor.
Dew Point
Dew point is the temperature to which air must be cooled for saturation (100% relative
humidity) to occur, providing there is no change in water vapor content. The dew point
is an important measurement used to predict the formation of dew, frost, and fog. If
dew point and temperature are close together in the late afternoon when the air begins
to turn colder, fog is likely during the night. Dew point is also a good indicator of the
air’s actual water vapor content, unlike relative humidity, which takes the air’s temperature into account. High dew point indicates high water vapor content; low dew point
indicates low water vapor content. In addition a high dew point indicates a better
chance of rain, severe thunderstorms, and tornados.
You can also use dew point to predict the minimum overnight temperature. Provided no
new fronts are expected overnight and the afternoon relative humidity is greater than or
equal to 50%, the afternoon’s dew point gives you an idea of what minimum temperature to expect overnight, since the air can never get colder than the dew point. Dew
point is equal to air temperature when humidity = 100%.
Rain
Vantage Pro2 incorporates a tipping-bucket rain collector in the ISS that measures
0.01» for each tip of the bucket. A metric adapter can be installed to measure 0.2 mm
for each tip of the bucket.Your station logs rain data in the same units it is measured in
and converts the logged totals into the selected display units (inches or millimeters) at
42

the time it is displayed. Converting at display time reduces possible compounded
rounding errors over time.
Four separate variables track rain totals: “rain storm,” “daily rain,” “monthly rain,” and
“yearly rain.” Rain rate calculations are based on the interval of time between each
bucket tip, which is each 0.01» rainfall increment or 0.2 mm.
Barometric Pressure
The weight of the air that makes up our atmosphere exerts a pressure on the surface of
the earth. This pressure is known as atmospheric pressure. Generally, the more air
above an area, the higher the atmospheric pressure, this means that atmospheric pressure changes with altitude. For example, atmospheric pressure is greater at sea level
than on a mountaintop. To compensate for this difference and facilitate comparison
between locations with different altitudes, atmospheric pressure is generally adjusted to
the equivalent sea level pressure. This adjusted pressure is known as barometric pressure. In reality, the Vantage Pro2 measures atmospheric pressure. When you enter your
location’s altitude in Setup Mode, the Vantage Pro2 stores the necessary offset value to
consistently translate atmospheric pressure into barometric pressure.
Barometric pressure also changes with local weather conditions, making barometric
pressure an extremely important and useful weather forecasting tool. High pressure
zones are generally associated with fair weather while low pressure zones are generally
associated with poor weather. For forecasting purposes, however, the absolute barometric pressure value is generally less important than the change in barometric pressure. In
general, rising pressure indicates improving weather conditions while falling pressure
indicates deteriorating weather conditions.
Solar Radiation
What we call “current solar radiation” is technically known as Global Solar Radiation,
a measure of the intensity of the sun’s radiation reaching a horizontal surface. This irradiance includes both the direct component from the sun and the reflected component
from the rest of the sky. The solar radiation reading gives a measure of the amount of
solar radiation hitting the solar radiation sensor at any given time, expressed in Watts/
sq. meter (W/m
2
). Solar radiation requires the solar radiation sensor.
UV (Ultra Violet) Radiation
Energy from the sun reaches the earth as visible, infrared, and ultraviolet (UV) rays.
Exposure to UV rays can cause numerous health problems, such as sunburn, skin cancer, skin aging, cataracts, and can suppress the immune system. The Vantage Pro2 helps
analyze the changing levels of UV radiation and can advise of situations where exposure is particularly unacceptable. UV radiation requires the UV radiation sensor. The
Vantage Pro2 displays UV readings in two scales: MEDs and UV Index.
Note: Your station’s UV readings do not take into account UV reflected off snow, sand, or
water, which can significantly increase your exposure. Nor do your UV readings take
into account the dangers of prolonged UV exposure. The readings do not suggest
that any amount of exposure is safe or healthful. Do not use the Vantage Pro2 to
determine the amount of UV radiation to which you expose yourself. Scientific evi-
43

dence suggests that UV exposure should be avoided and that even low UV doses
can be harmful.
UV MEDs
MED (Minimum Erythemal Dose) is defined as the amount of sunlight exposure necessary to induce a barely perceptible redness of the skin within 24 hours after sun exposure. In other words, exposure to 1 MED will result in a reddening of the skin. Because
different skin types burn at different rates, 1 MED for persons with very dark skin is
different from 1 MED for persons with very light skin.
Both the U.S. Environmental Protection Agency (EPA) and Environment Canada have
developed skin type categories correlating characteristics of skin with rates of sunburn.
T
ABLE A-1: EPA SKIN PHOTOTYPES
Skin Phototype Skin Color Tanning & Sunburn history
1 — Never tans,
always burns
2 — Sometimes tans,
usually burns
3 — Usually tans,
sometimes burns
4 — Always tans;
rarely burns
Pale or milky white;
alabaster
Very light brown;
sometimes freckles
Light tan; brown, or
olive; distinctly
pigmented
Brown, dark brown, or
black
Develops red sunburn; painful swelling,
skin peels
Usually burns, pinkish or red coloring
appears; can gradually develop light
brown tan
Rarely burns; shows moderately rapid
tanning response
Rarely burns; shows very rapid tanning
response
44

T
ABLE A-2: ENVIRONMENT CANADA SKIN TYPES AND
REACTION TO THE SUN
A
Skin Type Skin Color History of Tanning & Sunburning
I White Always burns easily, never tans
II White Always burns easily, tans minimally
III Light Brown Burns moderately, tans gradually
IV
Moderate
Brown
Burns minimally, tans well
V Dark Brown Burns rarely, tans profusely
VI Black Never burns, deep pigmentation
a. Developed by T. B. Fitzpatrick of the Harvard Medical School.
More about the Fitzpatrick Skin Types is available in: Fitzpatrick
TB. Editorial: the validity and practicality of sun-reactive skin types
I through VI. Arch Dermatol 1988; 124:869-871
1
UV Dose that
Causes Sunburn
2
Some burn
3
Skin Phototype (EPA)
4
20 40 60 80 100 120
12345
All Burn
UV Dose (MEDs)
I
II
III
IV
V
Skin Type (Environment Canada)
VI
2
mJ/cm
6
UV Dose and Sunburn — Use this plot to estimate the MED dose leading to
sunburn. A person with Type II (Environment Canada) skin type might choose
0.75 MED as the maximum for the day; in contrast, a person with Type V
(Environment Canada) Skin Type might consider 2.5 MEDs a reasonable
dose for the day. NOTE: the Vantage Pro2 assumes a Fitzpatrick (Environment Canada) Skin Type of II.
UV Index
Vantage Pro2 can also display UV Index, an intensity measurement first defined by
Environment Canada and since been adopted by the World Meteorological Organization. UV Index assigns a number between 0 and 16 to the current UV intensity. The US
EPA categorizes the Index values as shown in table A-3. The lower the number, the
lower the danger of sunburn. The Index value published by the U.S. National Weather
Service is a forecast of the next day’s noontime UV intensity. The index values displayed by the Vantage Pro2 are real-time measurements.
45

T
ABLE A-3: UV INDEX
Index Values Exposure Category
0 — 2 Low
3 — 4 Moderate
5 — 6 High
7 — 9 Very High
10+ Extreme
Evapotranspiration (ET)
Evapotranspiration (ET) is a measurement of the amount of water vapor returned to the
air in a given area. It combines the amount of water vapor returned through evaporation
(from wet surfaces) with the amount of water vapor returned through transpiration
(exhaling of moisture through plant stomata) to arrive at a total. Effectively, ET is the
opposite of rainfall, and it is expressed in the same units of measure (inches, millimeters).
The Vantage Pro2 uses air temperature, relative humidity, average wind speed, and
solar radiation data to estimate ET, which is calculated once an hour on the hour. ET
requires the optional solar radiation sensor.
Leaf Wetness
Leaf wetness (see “Optional Sensors & Transmitting Stations” on page 2) provides an
indication of whether the surface of foliage in the area is wet or dry by indicating how
wet the surface of the sensor is. The leaf wetness reading ranges from 0 (dry) to 15.
Leaf wetness requires an optional Leaf & Soil Moisture/Temperature Station and is
only available for Wireless Vantage Pro2 Stations.
Soil Moisture
Soil Moisture, as the name suggests, is a measure of the moisture content of the soil.
Soil moisture is measured on a scale of 0 to 200 centibars, and can help choose times to
water crops. The soil moisture sensor measures the vacuum created in the soil by the
lack of moisture. A high soil moisture reading indicates dryer soil; a lower soil moisture reading means wetter soil. Soil Moisture requires an optional Leaf & Soil Moisture/Temperature Station or Soil Moisture Station and is only available for Wireless
Vantage Pro2 Stations.
Time
The console has a built-in clock and calendar track the time and date. It automatically
adjusts for daylight saving time in most of North America and Europe (and allows
manual adjustment elsewhere) and for leap years, providing you have entered the correct year, latitude and longitude, and dayling saving settings in the Setup Mode.
46

Appendix B
Specifications
See complete specifications for your Vantage Pro2 Station at our website:
www.davisnet.com.
Console Specifications
Console Operating Temperature. . . . . . . . +32° to +140°F (0° to +60°C)
Non-operating Temperature . . . . . . . . . . . +14° to +158°F (-10° to +70°C)
Console Current Draw . . . . . . . . . . . . . . . Wireless: 0.9 mA average, 30 mA
Power Adapter . . . . . . . . . . . . . . . . . . . . . 5 VDC, 300 mA
Battery Backup . . . . . . . . . . . . . . . . . . . . 3 C-cells
Battery Life (no AC power) . . . . . . . . . . . . Wireless: up to 9 months; (Cabled:
Connectors. . . . . . . . . . . . . . . . . . . . . . . . Modular RJ-11
Housing Material. . . . . . . . . . . . . . . . . . . . UV-resistant ABS plastic
Console Display Type. . . . . . . . . . . . . . . . LCD Transflective
Display Backlight . . . . . . . . . . . . . . . . . . . LEDs
Dimensions:
Console (with antenna) . . . . . . . . . . . 10.625″ x 6.125″ x 1.625″ (270 mm x
Console (no antenna) . . . . . . . . . . . . 9.625″ x 6.125″ x 1.625″ (244 mm x
Display . . . . . . . . . . . . . . . . . . . . . . . 5.94″ x 3.375″ (151 mm x 86 mm)
Weight (with batteries). . . . . . . . . . . . 1.88 lbs. (.85 kg)
peak, (add 120 mA for display lamps,
add 0.125 mA for each optional
transmitter station received by console) at 4 to 6 VDC
Cabled: 10 mA (average), 15 mA
(peak) (+80 mA for illuminated display) at 4 to 6 VDC
approximately 1 month)
156 mm x 41 mm)
156 mm x 41 mm)
Wireless Communication Specifications
Transmit/Receive Frequency
US Models: . . . . . . . . . . . . . . . . . . . 902 — 928 MHz FHSS
Overseas Models: . . . . . . . . . . . . . . . 868.0 — 868.6 MHz FHSS
ID Codes Available . . . . . . . . . . . . . . . . . . 8
Output Power . . . . . . . . . . . . . . . . . . . . . . 902 — 928 MHz FHSS: FCC-certified
low power, less than 8 mW, no license required
868.0 -868.6 MHz: CE-certified, less
than 8 mW, no license required
Range
Line of Sight . . . . . . . . . . . . . . . . . . . up to 1000 feet (300 m)
Through Walls. . . . . . . . . . . . . . . . . . 200 to 400 feet (75 to 120 m)
47

Console Data Display Specifications
Console Data Display Specifications
Historical Data . . . . . . . . . . . . . . . . . . . . . Includes the past 24 values listed un-
less otherwise noted; all can be
cleared and all totals reset.
Daily Data. . . . . . . . . . . . . . . . . . . . . . . . . Includes the earliest time of occur-
rence of highs and lows; period begins/ends at 12:00 am.
Monthly Data . . . . . . . . . . . . . . . . . . . . . . Period begins/ends at 12:00 am on
the first of every month.
Yearly Data. . . . . . . . . . . . . . . . . . . . . . . . Period begins/ends at 12:00 am on
January 1
Current Graph Data . . . . . . . . . . . . . . . . . Current data appears in the right
most column in the console graph
and represents the latest value within
the last period of the graph; totals
can be set or reset.
Graph Time Interval . . . . . . . . . . . . . . . . . 1 min., 10 min., 15 min., 1 hour, 1
day, 1 month, 1 year (user-selectable, availability depends upon variable selected).
Graph Time Span . . . . . . . . . . . . . . . . . . . 24 Intervals + Current Interval (see
Graph Intervals to determine time
span).
Graph Variable Span (Vertical Scale) . . . . Automatic (varies depending upon
data range); maximum and minimum
value in range appear in ticker.
Alarm Indication . . . . . . . . . . . . . . . . . . . . Alarms sound for 2 minutes (time
alarm is 1 minute) if operating on
battery power. Alarm message
displays in ticker as long as threshold
is met or exceeded. Alarms can be
silenced, but not cleared, by
pressing DONE.
Transmission Interval . . . . . . . . . . . . . . . . Varies with transmitter ID code —
from 2.25 seconds (ID1 = shortest) to
3 seconds (ID8 = longest).
Update Interval. . . . . . . . . . . . . . . . . . . . . Varies with sensor — see individual
sensor specs.
st
unless otherwise noted.
Forecast:
Variables Used . . . . . . . . . . . . . . . . . Barometric reading & trend, wind
speed & direction, rainfall, temperature, humidity, latitude & longitude,
time of year.
Update Interval . . . . . . . . . . . . . . . . . 1 hour
Display Format . . . . . . . . . . . . . . . . . Icons on top center of display; de-
tailed message in ticker at bottom.
Variables Predicted. . . . . . . . . . . . . . Sky condition, precipitation, temper-
ature changes, wind direction and
speed changes.
48

Weather Data Specifications
Weather Data Specifications
Note: These specifications include optional sensors that may not be installed in your Vantage Pro2
Station.
Weather Data Specifications
Variable
Barometric
*
Pressure
Barometric Trend
(3 hour)
Evapotranspiration
(ET)
Inside Humidity
Outside Humidity
Extra Humidity
Dew Point (overall)
Leaf Wetness
Soil Moisture
Daily & Storm
Rainfall
Monthly & Yearly
Rainfall
Rain Rate 0.01”; 0.2 mm
Required
Sensors
Included in
Console
ISS or Temp/
Hum Station &
Solar Radiation
sensor
Included in
Console
ISS or Temp/
Hum Station
ISS or Temp/
Hum Station
ISS or Temp/
Hum Station
Leaf & Soil
Station
Leaf & Soil
Station or Soil
Moisture Station
Rain Collector
Resolution Range
0.01» Hg; 0.1 mm;
0.1 hPa; 0.1 mb
Change Rates
Rapidly: .06» Hg
1.5 mm Hg
2 hPa, 2 mb;
Slowly: .02» Hg
0.5 mm Hg
0.7 hPa, 0.7 mb
0.01»; 0.1 mm
1% 1 to 100%
1% 1 to 100%
1% 1 to 100%
1F; 1C
1 0 to 15 0.5
1 cb 0 to 200 cb
0.01»; 0.2 mm
0.01»; 0.2 mm
(1mm at totals over
2000 mm)
16» to 32.5» Hg
410 to 820 mm
540 to 1100 hPa
540 to 1100 mb
5 Arrow Positions:
Rising Rapidly
Rising Slowly
Steady
Falling Slowly
Falling Rapidly
Daily to 32.67”;
832.1 mm
Monthly & Yearly
to 199.99”;
1999.9 mm
-105 to +130F;
-76 to +54C
to 99.99»;
999.8 mm
to 199.99»;
6553 mm
to 96»/hr.;
2438 mm/hr.
Nominal
Accuracy (+/-)
0.8 mm Hg
**
greater of 5% or
0.01»; 0.25 mm
4% above 90%
4% above 90%
4% above 90%
3F; 1.5C
greater of 4% or
greater of 4% or
greater of 5% or
0.03» Hg
1.0 hPa
1.0 mb
3% RH;
3% RH;
3% RH;
1 tip,
1 tip
0.04”/hr.;
1 mm/hr.
*
Barometric pressure readings are standardized to sea level. Elevation Range: -999’ to +15,000’;
-600 to + 4570 m. Note: The console screen limits display of lower elevation to -999’ when using feet
as elevation unit. For elevations lower than -999’, use meters.
**
This is the reduced value after standardizing to sea level.
49

Weather Data Specifications
Weather Data Specifications
Variable
Required
Sensors
Resolution Range
Solar Radiation Solar sensor 1 W/m
Inside
Temperature
Outside
Temperature
***
Included in
Console
ISS, Temp
Station or Temp
Hum Station
0.1F; 0.1C
0.1F; 0.1C
2
0 to 1800 W/m25% of full scale
+32 to +140F;
0 to +60C
-40 to +150F;
-40 to +65C
Nominal
Accuracy (+/-)
1F; 0.5C
1F; 0.5C
ISS, Temp
Extra Temperature
Station, Temp
Hum Station,
Leaf Soil Station
1F; 1C
-40 to +150F
-40 to +65C
1F; 0.5C
or Soil Station
Heat Index
Temp-Hum-Sun-
Wind index
(THSW)
Time
Date 1 day month/day 8 sec./mon.
UV Index
UV Dose
Wind Direction
Compass Rose
ISS or Temp/
Hum Station
ISS & Solar
Radiation
Included in
Console
UV Radiation
1F; 1C
1F; 1C
1 min 24 hours 8 sec./mon.
0.1 Index 0 to 16 5% of full scale
0.1 MED < 20,
1 MED > 20
1 0 to 360 3
22.5 16 compass pts 0.3 compass pt
Anemometer
Wind Speed (large
cups)
1 mph; 1 kt; 0.4 m/
s; 1 km/h
Wind Chill ISS 1F; 1C
***
Outside temperature accuracy is based on the temperature sensor itself and not on the sensor and
-40to +165F;
-40 to +74 C
-90 to +165F;
-68 to +74 C
3F (1.5C)
4F (2C)
0 to 199 MEDs 5%
2 to 180 mph;
2 to 156 kts
3 to 290 km/h,
1 to 80 m/s
-110 to +135F
-79 to +57C
greater of
2 mph/kts;
1 m/s; 3 km/h
or 5%
2F;1C
the passive shielding together. The solar radiation induced error for standard ration shield: +4F (2C)
at solar noon; for fan aspirated radiation shield: +0.6F (0.3C) at solar noon (insolation = 1040 W/
2
, avg. wind speed 2 mph (1 m/s), reference: RM Young Model 43408 Fan-Aspirated Radiation
m
Shield).
50

Appendix C
Wireless Repeater Configuration
A Vantage Pro2 Wireless Repeater (#7626, #7627) or Long-Range Wireless Repeater
(#7653, #7654) increase transmission distances or improve transmission quality
between a station and a console. A repeater receives information transmitted from a
Vantage Pro2 station and retransmits it to a console. Depending on transmission distance, one repeater or several repeaters can be used to collect and retransmit weather
data.
All consoles communicating with repeaters must be set up with the correct Transmitter
ID and Repeater ID before the console can correctly receive station information.
To set Repeater ID on the console:
1. Press DONE and the — keys to enter Setup Mode.
2. If Setup Mode has previously been completed, press DONE to display Screen 2:
Configuring Transmitter IDs.
3. See “Screen 2: Configuring Transmitter IDs — Wireless Only” on page 10 for more
information on configuring Transmitter IDs.
4. Press 2ND and then press WIND to enter Repeater Setup Mode and to select a
Repeater ID. Pressing 2ND and WIND sets the console to receive the signal from a
repeater instead of directly from a station. Once the console is in the repeater setup
mode, subsequent pressing of WIND continue to cycle through the all the repeater
IDs.
5. Press WIND repeatedly to cycle through all eight repeater IDs possible or to clear
the repeater ID in the right hand corner. When no repeater ID is shown, the console
is configured to listen directly to a station and not to a repeater.
In the example below, the console is set up to receive an ISS station on transmitter
ID 1 from repeater A.
1
6. For each station using a repeater, select the station and turn on the repeater function
and select the correct repeater ID.
7. Press DONE to continue to the other screens in the Setup Mode, or press and hold
DONE to return to the Current Weather Mode.
Note: In console with the October 2005 version of firmware, the only way to exit Repeater
Setup mode is to press DONE to continue to the next setup screen.
Verifying Setup
To verify that you have successfully set up your console to receive a repeater in the
console’s Current Weather Mode:
1. View the transmitter information displaying at the bottom of the
console screen.
51

If the transmitter ID being repeated is displayed and an “X” flashes in the bottom
right corner of the ticker tape, the transmitter is being repeated and received by the
console successfully.
The repeater’s information also displays at the bottom of the console’s diagnostics
screens.
Clearing Repeater ID
If a repeater ID is being displayed in Screen 2 and you are not using a repeater with the
selected station, you must turn off the repeater function to receive station information
successfully.
In Setup Screen 2:
Press 2ND and then press WIND repeatedly so that the console cycles through the list
of repeater IDs (Repeaters A-H) until the section where the repeater ID was displayed
is blank. Press DONE to continue to the next screen or press and hold DONE to return
to the Current Weather Mode.
52

Vantage Pro2 Console Icons
Console icons indicate weather conditions and special functions.
Forecast
Mostly Clear Partly Cloudy Mostly Cloudy SnowRain
Indicates the weather forecast for the next 12 hours.
Moon Phase
New Moon First Quarter Full Moon Last Quarter New Moon
Shows the current moon phase. Sequence shown for Northern Hemisphere. The
sequence of the icons is reversed in the Southern Hemisphere.
Alarm Bell
Flashes when an alarm is triggered. Also indicates when the console is
in Alarm Mode.
Graph
Appears next to the currently selected weather variable. Also indicates
the graphed variable on most screens.
Second Function
Appears when you press
functions are enabled.
Rain
Appears when the console is currently detecting rain.
Barometric Pressure Trend
Arrows show direction of pressure change for last three hours.
2ND key. Indicates that console key secondary
ND
2
Contacting Davis Technical Support
For questions about installing or operating your Vantage Pro2 weather station,
please contact Davis Technical Support. We’ll be glad to help.
(510) 732-7814 — Monday — Friday, 7:00 a.m. — 5:30 p.m. Pacific Time. We are
unable to accept collect calls.
(510) 670-0589 — Technical Support Fax.
support@davisnet.com — E-mail to Technical Support.
info@davisnet.com — General e-mail.
www.davisnet.com — Davis Instruments web site. See the Weather Support sec-
tion for copies of user manuals, product specifications, application notes, and information on software updates. Watch for FAQs and other updates.
53
Loading…
Скачать
Vantage Pro2
Console Manual
™
For Vantage Pro2 & Vantage Pro2 Plus Weather Stations
™
™
Davis Instruments, 3465 Diablo Avenue, Hayward, CA 94545 • 510-732-9229 • www.davisnet.com
Vantage Pro 2 – это экономичная метеостанция Davis, предлагаемая в двух вариантах: с проводным и беспроводным подключением.
Оба предлагаемых варианта Vantage Pro 2 включают в себя инновационный интегрированный набор датчиков, объединяющий в себе дождеприёмник, датчики температуры и влажности и анемометр.
Компания Spectrum разработала специальные решения для эксплуатации данной метеорологической станции. Модификации делают настройку устройства проще, чем когда-либо, а также повышает его производительность и надежность.
| Название изделия | Код продукта |
|---|---|
| Кабельная версия метеостанции Vantage Pro 2 | 3340CVP2 |
| Беспроводная версия метеостанции Vantage Pro 2 | 3340WVP2 |
Особенности метеостанции Vantage Pro 2
- Предлагаемые станции Vantage Pro2 доступны как в беспроводной, так и в проводной версии.
- Станция включает в себя консоль / пульт Vantage Pro 2, встроенный набор датчиков и монтажное оборудование.
- Интегрированный набор датчиков состоит из коллектора дождя, датчиков температуры и влажности, анемометра, кабеля анемометра длиной 12 м и солнечной панели.
- Электронные компоненты станции размещены в защищенном от атмосферных воздействий укрытии. Для повышения точности датчики температуры и влажности помещены под прикрытие радиационного щита.
- Консоль Vantage Pro 2 может питаться от прилагаемого адаптера переменного тока или от трех батареек C, не входящих в комплект. Сенсорный блок работает на солнечной энергии.
- Значки быстрого просмотра консоли Vantage Pro 2 позволяют сразу увидеть прогноз – в ходе того, как на постоянно обновляемом экране появляются подробные сведения. Также на дисплее этого пульта отображаются графики.
- Имеется возможность переключения одним нажатием кнопки между метрическими и американскими единицами измерения.
- Беспроводная передача осуществляется на расстоянии до 300 м на открытом воздухе в пределах прямой видимости. Типичный диапазон прохождения сигнала сквозь стены при большинстве условий составляет от 60 до 120 м.
- Кабельный вариант станции включает в себя кабель длиной 30 м от консоли Vantage Pro 2 до комплекта датчиков.
Технические характеристики метеорологических станций Vantage Pro 2

Дополнительные сведения о метеостанциях Vantage Pro 2
Вы можете просмотреть или скачать следующие англоязычные материалы:
- руководство по установке для метеостанций Davis Vantage Pro 2 (коды продуктов 3340CVP2 и 3340WVP2) – PDF;
- руководство по эксплуатации для консоли метеостанций Davis Vantage Pro 2 (коды изделий 3340CVP2 и 3340WVP2) – PDF.
Воспользуйтесь нашим ОПРОСНЫМ ЛИСТОМ, чтобы ускорить процесс получения технико-коммерческого предложения.